
|
China Satellite Communications Co., Ltd. (601698.SS) Évaluation DCF |
Entièrement Modifiable: Adapté À Vos Besoins Dans Excel Ou Sheets
Conception Professionnelle: Modèles Fiables Et Conformes Aux Normes Du Secteur
Pré-Construits Pour Une Utilisation Rapide Et Efficace
Compatible MAC/PC, entièrement débloqué
Aucune Expertise N'Est Requise; Facile À Suivre
China Satellite Communications Co., Ltd. (601698.SS) Bundle
Rationalisez votre analyse et améliorez la précision avec notre calculatrice DCF (601698SS)! En utilisant des données réelles de China Satellite Communications Co., Ltd. et des hypothèses personnalisables, cet outil vous permet de prévoir, évaluer et évaluer (601698SS) comme un investisseur chevronné.
What You Will Receive
- Customizable Excel Template: A fully adjustable Excel-based DCF Calculator featuring pre-filled actual financial data for China Satellite Communications Co., Ltd. (601698SS).
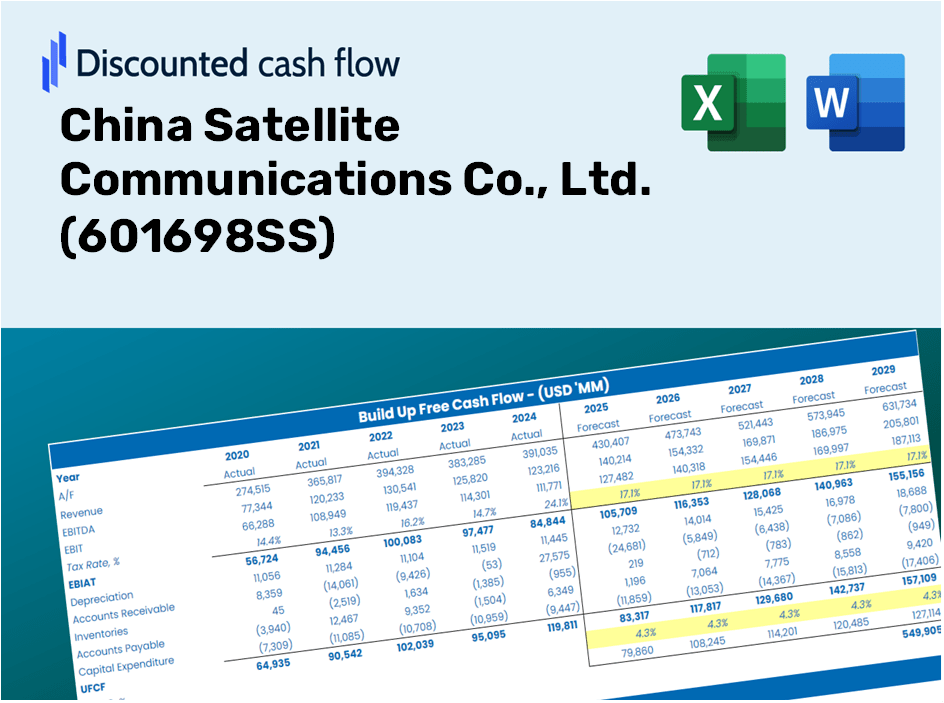
- Real-Time Data: Access to historical data along with forward-looking projections (highlighted in the yellow cells).
- Adaptable Forecasting: Modify key forecast assumptions such as revenue growth, EBITDA %, and WACC.
- Instant Calculations: Quickly assess how your inputs affect the valuation of China Satellite Communications Co., Ltd. (601698SS).
- Professional Grade Tool: Designed for investors, CFOs, consultants, and financial analysts.
- Intuitive Interface: Organized for clarity and simplicity, featuring step-by-step guidance.
Key Features
- 🔍 Real-Life China's Satellite Financials: Pre-filled historical and projected data for China Satellite Communications Co., Ltd. (601698SS).
- ✏️ Fully Customizable Inputs: Adjust all key parameters (yellow cells) such as WACC, growth %, and tax rates.
- 📊 Professional DCF Valuation: Embedded formulas calculate the intrinsic value of China Satellite Communications Co., Ltd. (601698SS) using the Discounted Cash Flow method.
- ⚡ Instant Results: Visualize the valuation for China Satellite Communications Co., Ltd. (601698SS) immediately after making adjustments.
- Scenario Analysis: Evaluate and contrast outcomes for different financial assumptions side-by-side.
How It Works
- Download: Get the pre-configured Excel file featuring China Satellite Communications Co., Ltd. (601698SS) financial data.
- Customize: Modify projections such as revenue growth, EBITDA percentage, and WACC.
- Update Automatically: Watch as the intrinsic value and NPV calculations refresh in real-time.
- Test Scenarios: Develop various forecasts and instantly compare the results.
- Make Decisions: Utilize the valuation findings to inform your investment approach.
Why Choose This Calculator for China Satellite Communications Co., Ltd. (601698SS)?
- Precision: Utilizes real financial data for accurate results.
- Versatility: Allows users to experiment with and adjust inputs as needed.
- Efficiency: Avoid the complexities of creating a DCF model from the ground up.
- High-Quality: Crafted with the expertise and standards expected at the CFO level.
- Intuitive: Designed to be straightforward for users, regardless of their financial modeling experience.
Who Can Benefit from This Product?
- Investors: Effectively assess the fair value of China Satellite Communications Co., Ltd. (601698SS) prior to making investment choices.
- CFOs: Utilize a professional-grade DCF model for thorough financial reporting and analysis.
- Consultants: Efficiently customize the template for client valuation reports.
- Entrepreneurs: Acquire valuable insights into the financial modeling practices of leading companies.
- Educators: Employ it as a resource to illustrate various valuation methodologies in the classroom.
Contents of the Template
- Historical Data: Contains past financials and baseline forecasts for China Satellite Communications Co., Ltd. (601698SS).
- DCF and Levered DCF Models: Comprehensive templates for calculating the intrinsic value of China Satellite Communications Co., Ltd. (601698SS).
- WACC Sheet: Pre-built computations for the Weighted Average Cost of Capital.
- Editable Inputs: Adjust key drivers such as growth rates, EBITDA %, and CAPEX projections.
- Quarterly and Annual Statements: Detailed breakdown of the financials for China Satellite Communications Co., Ltd. (601698SS).
- Interactive Dashboard: Dynamic visualization of valuation outcomes and forecasts.
Disclaimer
All information, articles, and product details provided on this website are for general informational and educational purposes only. We do not claim any ownership over, nor do we intend to infringe upon, any trademarks, copyrights, logos, brand names, or other intellectual property mentioned or depicted on this site. Such intellectual property remains the property of its respective owners, and any references here are made solely for identification or informational purposes, without implying any affiliation, endorsement, or partnership.
We make no representations or warranties, express or implied, regarding the accuracy, completeness, or suitability of any content or products presented. Nothing on this website should be construed as legal, tax, investment, financial, medical, or other professional advice. In addition, no part of this site—including articles or product references—constitutes a solicitation, recommendation, endorsement, advertisement, or offer to buy or sell any securities, franchises, or other financial instruments, particularly in jurisdictions where such activity would be unlawful.
All content is of a general nature and may not address the specific circumstances of any individual or entity. It is not a substitute for professional advice or services. Any actions you take based on the information provided here are strictly at your own risk. You accept full responsibility for any decisions or outcomes arising from your use of this website and agree to release us from any liability in connection with your use of, or reliance upon, the content or products found herein.