
|
Anhui Xinhua Media Co., Ltd. (601801.SS) Évaluation DCF |
Entièrement Modifiable: Adapté À Vos Besoins Dans Excel Ou Sheets
Conception Professionnelle: Modèles Fiables Et Conformes Aux Normes Du Secteur
Pré-Construits Pour Une Utilisation Rapide Et Efficace
Compatible MAC/PC, entièrement débloqué
Aucune Expertise N'Est Requise; Facile À Suivre
Anhui Xinhua Media Co., Ltd. (601801.SS) Bundle
Explorez l'avenir financier d'Anhui Xinhua Media Co., Ltd. (601801SS) avec notre calculatrice DCF conviviale! Entrez simplement vos hypothèses concernant la croissance, les marges et les dépenses pour calculer la valeur intrinsèque d'Anhui Xinhua Media Co., Ltd. (601801SS) et améliorez votre stratégie d'investissement.
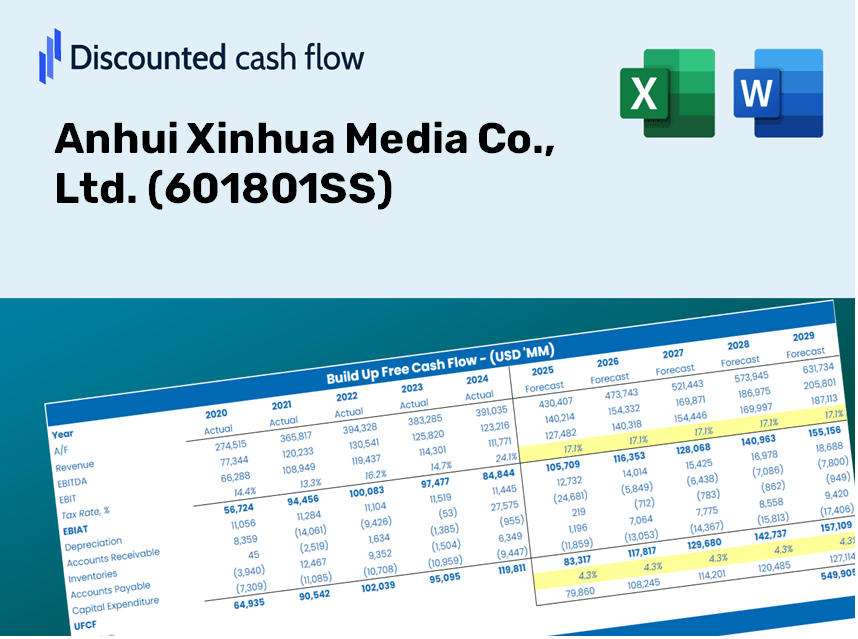
Discounted Cash Flow (DCF) - (USD MM)
| Year | AY1 2020 |
AY2 2021 |
AY3 2022 |
AY4 2023 |
AY5 2024 |
FY1 2025 |
FY2 2026 |
FY3 2027 |
FY4 2028 |
FY5 2029 |
|---|---|---|---|---|---|---|---|---|---|---|
| Revenue | 8,850.9 | 10,111.8 | 11,686.6 | 11,243.7 | 10,748.8 | 11,330.0 | 11,942.7 | 12,588.5 | 13,269.1 | 13,986.6 |
| Revenue Growth, % | 0 | 14.25 | 15.57 | -3.79 | -4.4 | 5.41 | 5.41 | 5.41 | 5.41 | 5.41 |
| EBITDA | 609.1 | 811.3 | 841.3 | 949.3 | 767.7 | 854.0 | 900.2 | 948.9 | 1,000.2 | 1,054.2 |
| EBITDA, % | 6.88 | 8.02 | 7.2 | 8.44 | 7.14 | 7.54 | 7.54 | 7.54 | 7.54 | 7.54 |
| Depreciation | 52.5 | 191.9 | 204.6 | 215.8 | 75.3 | 155.5 | 163.9 | 172.8 | 182.1 | 191.9 |
| Depreciation, % | 0.5934 | 1.9 | 1.75 | 1.92 | 0.70084 | 1.37 | 1.37 | 1.37 | 1.37 | 1.37 |
| EBIT | 556.6 | 619.4 | 636.7 | 733.5 | 692.3 | 698.5 | 736.3 | 776.1 | 818.1 | 862.3 |
| EBIT, % | 6.29 | 6.13 | 5.45 | 6.52 | 6.44 | 6.17 | 6.17 | 6.17 | 6.17 | 6.17 |
| Total Cash | 7,561.4 | 8,298.4 | 9,327.3 | 10,676.7 | 11,495.1 | 10,021.8 | 10,563.7 | 11,134.9 | 11,737.0 | 12,371.7 |
| Total Cash, percent | .0 | .0 | .0 | .0 | .0 | .0 | .0 | .0 | .0 | .0 |
| Account Receivables | 1,283.3 | 702.5 | 980.1 | 993.9 | 1,226.1 | 1,134.8 | 1,196.2 | 1,260.8 | 1,329.0 | 1,400.9 |
| Account Receivables, % | 14.5 | 6.95 | 8.39 | 8.84 | 11.41 | 10.02 | 10.02 | 10.02 | 10.02 | 10.02 |
| Inventories | 1,520.8 | 2,432.7 | 1,840.1 | 1,651.3 | 1,524.4 | 1,945.5 | 2,050.7 | 2,161.6 | 2,278.5 | 2,401.7 |
| Inventories, % | 17.18 | 24.06 | 15.75 | 14.69 | 14.18 | 17.17 | 17.17 | 17.17 | 17.17 | 17.17 |
| Accounts Payable | 2,221.2 | 2,725.1 | 2,867.1 | 2,944.4 | 2,083.6 | 2,767.9 | 2,917.6 | 3,075.4 | 3,241.7 | 3,417.0 |
| Accounts Payable, % | 25.1 | 26.95 | 24.53 | 26.19 | 19.38 | 24.43 | 24.43 | 24.43 | 24.43 | 24.43 |
| Capital Expenditure | -133.4 | -153.4 | -104.8 | -288.7 | -181.2 | -185.2 | -195.3 | -205.8 | -216.9 | -228.7 |
| Capital Expenditure, % | -1.51 | -1.52 | -0.89702 | -2.57 | -1.69 | -1.63 | -1.63 | -1.63 | -1.63 | -1.63 |
| Tax Rate, % | 18.45 | 18.45 | 18.45 | 18.45 | 18.45 | 18.45 | 18.45 | 18.45 | 18.45 | 18.45 |
| EBITAT | 515.5 | 584.2 | 600.2 | 816.6 | 564.6 | 646.5 | 681.4 | 718.3 | 757.1 | 798.1 |
| Depreciation | ||||||||||
| Changes in Account Receivables | ||||||||||
| Changes in Inventories | ||||||||||
| Changes in Accounts Payable | ||||||||||
| Capital Expenditure | ||||||||||
| UFCF | -148.4 | 795.4 | 1,156.9 | 996.1 | -507.4 | 971.2 | 633.2 | 667.4 | 703.5 | 741.5 |
| WACC, % | 5.55 | 5.56 | 5.56 | 5.6 | 5.48 | 5.55 | 5.55 | 5.55 | 5.55 | 5.55 |
| PV UFCF | ||||||||||
| SUM PV UFCF | 3,188.8 | |||||||||
| Long Term Growth Rate, % | 2.00 | |||||||||
| Free cash flow (T + 1) | 756 | |||||||||
| Terminal Value | 21,296 | |||||||||
| Present Terminal Value | 16,254 | |||||||||
| Enterprise Value | 19,443 | |||||||||
| Net Debt | -8,897 | |||||||||
| Equity Value | 28,340 | |||||||||
| Diluted Shares Outstanding, MM | 1,958 | |||||||||
| Equity Value Per Share | 14.47 |
What You Will Receive
- Authentic 601801SS Financial Data: Pre-populated with Anhui Xinhua Media's historical and forecasted data for accurate analysis.
- Customizable Template: Easily adjust key metrics such as revenue growth, WACC, and EBITDA %.
- Real-Time Calculations: Observe immediate updates to Anhui Xinhua Media’s intrinsic value with any adjustments you make.
- Professional Valuation Instrument: Tailored for investors, analysts, and consultants aiming for precise DCF evaluations.
- User-Friendly Interface: Streamlined layout and clear directions suitable for users of all skill levels.
Key Features
- Comprehensive AHM Data: Pre-populated with Anhui Xinhua Media Co., Ltd.'s historical financials and forecasts.
- Customizable Parameters: Modify revenue growth rates, profit margins, WACC, tax rates, and capital expenditure assumptions.
- Interactive Valuation Model: Automatic recalculations of Net Present Value (NPV) and intrinsic value based on user-defined inputs.
- Scenario Analysis: Generate various forecasting scenarios to evaluate different valuation results.
- User-Friendly Interface: Intuitive design that caters to both professionals and newcomers.
How It Works
- 1. Access the Template: Download and open the Excel file featuring Anhui Xinhua Media Co., Ltd.'s (601801SS) preloaded data.
- 2. Adjust Key Inputs: Modify important parameters such as growth projections, WACC, and capital expenditures.
- 3. Analyze Results Immediately: The DCF model automatically calculates the intrinsic value and NPV.
- 4. Explore Different Scenarios: Evaluate various forecasts to understand a range of valuation possibilities.
- 5. Present with Assurance: Share professional valuation analyses to enhance your decision-making process.
Why Opt for This Calculator for Anhui Xinhua Media Co., Ltd. (601801SS)?
- Reliable Data: Utilize authentic financial figures from Anhui Xinhua Media to guarantee trustworthy valuation outcomes.
- Tailor-Made: Customize essential variables such as growth rates, WACC, and tax parameters to align with your forecasts.
- Efficiency Boost: Pre-configured calculations save you the hassle of starting from square one.
- Expert-Level Tool: Crafted for investors, analysts, and consultants in the media sector.
- Easy to Use: Designed with a straightforward interface and clear instructions for users of all experience levels.
Who Should Use This Product?
- Individual Investors: Gain valuable insights for making informed decisions on investing in Anhui Xinhua Media Co., Ltd. (601801SS).
- Financial Analysts: Enhance valuation processes with easy-to-use financial models tailored for Anhui Xinhua Media Co., Ltd. (601801SS).
- Consultants: Provide clients with precise valuation analyses of Anhui Xinhua Media Co., Ltd. (601801SS) in a timely manner.
- Business Owners: Learn about the valuation methods of major players like Anhui Xinhua Media Co., Ltd. (601801SS) to inform your own business strategies.
- Finance Students: Explore valuation techniques using real data and examples from Anhui Xinhua Media Co., Ltd. (601801SS).
Contents of the Template
- Historical Data: Contains past financial information and baseline predictions for Anhui Xinhua Media Co., Ltd. (601801SS).
- DCF and Levered DCF Models: Comprehensive templates for assessing the intrinsic value of Anhui Xinhua Media Co., Ltd. (601801SS).
- WACC Sheet: Pre-configured calculations for the Weighted Average Cost of Capital.
- Editable Inputs: Adjust key factors such as growth rates, EBITDA percentages, and CAPEX estimates.
- Quarterly and Annual Statements: Detailed analysis of Anhui Xinhua Media Co., Ltd. (601801SS)'s financials.
- Interactive Dashboard: Dynamically visualize valuation outcomes and forecasts.
Disclaimer
All information, articles, and product details provided on this website are for general informational and educational purposes only. We do not claim any ownership over, nor do we intend to infringe upon, any trademarks, copyrights, logos, brand names, or other intellectual property mentioned or depicted on this site. Such intellectual property remains the property of its respective owners, and any references here are made solely for identification or informational purposes, without implying any affiliation, endorsement, or partnership.
We make no representations or warranties, express or implied, regarding the accuracy, completeness, or suitability of any content or products presented. Nothing on this website should be construed as legal, tax, investment, financial, medical, or other professional advice. In addition, no part of this site—including articles or product references—constitutes a solicitation, recommendation, endorsement, advertisement, or offer to buy or sell any securities, franchises, or other financial instruments, particularly in jurisdictions where such activity would be unlawful.
All content is of a general nature and may not address the specific circumstances of any individual or entity. It is not a substitute for professional advice or services. Any actions you take based on the information provided here are strictly at your own risk. You accept full responsibility for any decisions or outcomes arising from your use of this website and agree to release us from any liability in connection with your use of, or reliance upon, the content or products found herein.