
|
Beijing-Shanghai High-Speed Railway Co., Ltd. (601816.SS) Évaluation DCF |
Entièrement Modifiable: Adapté À Vos Besoins Dans Excel Ou Sheets
Conception Professionnelle: Modèles Fiables Et Conformes Aux Normes Du Secteur
Pré-Construits Pour Une Utilisation Rapide Et Efficace
Compatible MAC/PC, entièrement débloqué
Aucune Expertise N'Est Requise; Facile À Suivre
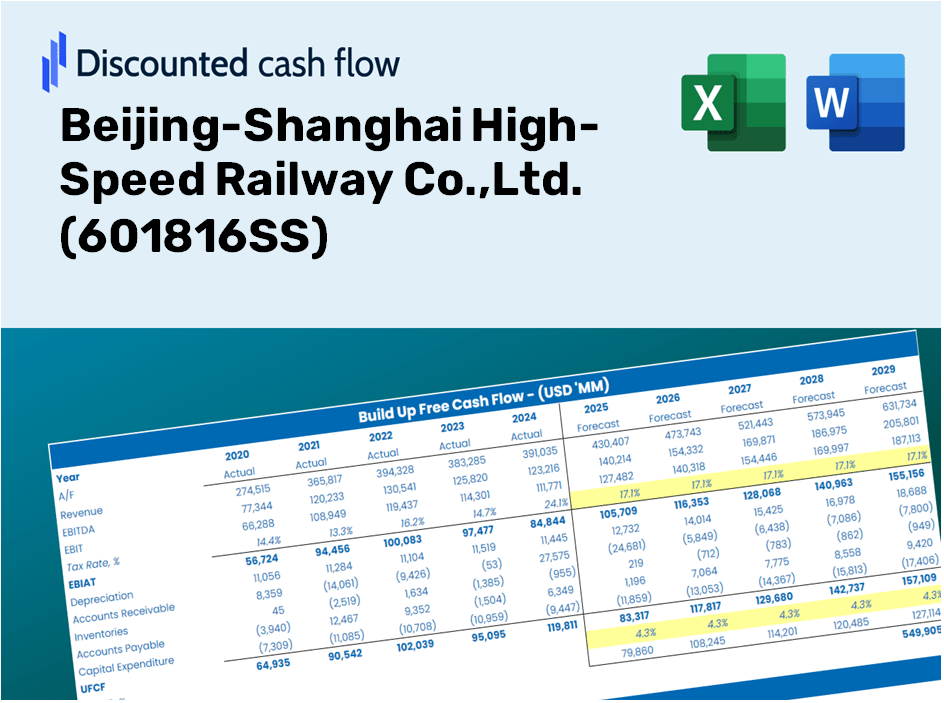
Beijing-Shanghai High-Speed Railway Co.,Ltd. (601816.SS) Bundle
Simplifier Beijing-Shanghai Railway Co., Ltd. (601816SS) Évaluation avec cette calculatrice DCF personnalisable! Avec Real Beijing-Shanghai High-Speed Railway Co., Ltd. (601816SS) Financials and Adjustable Prévisions Antaires, vous pouvez tester des scénarios et découvrir Pékin-Shanghai High-Speed Railway Co., Ltd. (601816SS) Juste valeur en minutes.
Discounted Cash Flow (DCF) - (USD MM)
| Year | AY1 2020 |
AY2 2021 |
AY3 2022 |
AY4 2023 |
AY5 2024 |
FY1 2025 |
FY2 2026 |
FY3 2027 |
FY4 2028 |
FY5 2029 |
|---|---|---|---|---|---|---|---|---|---|---|
| Revenue | 25,238.4 | 29,304.8 | 19,335.7 | 40,682.7 | 42,157.1 | 51,191.1 | 62,160.9 | 75,481.6 | 91,656.7 | 111,298.1 |
| Revenue Growth, % | 0 | 16.11 | -34.02 | 110.4 | 3.62 | 21.43 | 21.43 | 21.43 | 21.43 | 21.43 |
| EBITDA | 12,589.1 | 15,252.5 | 7,756.2 | 23,598.0 | 24,746.0 | 26,491.0 | 32,167.8 | 39,061.1 | 47,431.7 | 57,595.9 |
| EBITDA, % | 49.88 | 52.05 | 40.11 | 58.01 | 58.7 | 51.75 | 51.75 | 51.75 | 51.75 | 51.75 |
| Depreciation | 5,619.5 | 5,701.7 | 5,936.0 | 5,919.1 | 5,851.5 | 10,325.4 | 12,538.1 | 15,224.9 | 18,487.5 | 22,449.2 |
| Depreciation, % | 22.27 | 19.46 | 30.7 | 14.55 | 13.88 | 20.17 | 20.17 | 20.17 | 20.17 | 20.17 |
| EBIT | 6,969.5 | 9,550.7 | 1,820.2 | 17,678.9 | 18,894.5 | 16,165.6 | 19,629.7 | 23,836.2 | 28,944.1 | 35,146.7 |
| EBIT, % | 27.61 | 32.59 | 9.41 | 43.46 | 44.82 | 31.58 | 31.58 | 31.58 | 31.58 | 31.58 |
| Total Cash | 7,949.6 | 8,917.6 | 5,339.4 | 12,903.2 | 10,191.0 | 14,889.7 | 18,080.5 | 21,955.0 | 26,659.8 | 32,372.8 |
| Total Cash, percent | .0 | .0 | .0 | .0 | .0 | .0 | .0 | .0 | .0 | .0 |
| Account Receivables | 2,300.9 | 272.9 | 685.6 | 1,373.3 | 1,721.1 | 2,155.3 | 2,617.2 | 3,178.0 | 3,859.0 | 4,686.0 |
| Account Receivables, % | 9.12 | 0.93109 | 3.55 | 3.38 | 4.08 | 4.21 | 4.21 | 4.21 | 4.21 | 4.21 |
| Inventories | .0 | .0 | .0 | .0 | .0 | .0 | .0 | .0 | .0 | .0 |
| Inventories, % | 0 | 0 | 0 | 0 | 0 | 0 | 0 | 0 | 0 | 0 |
| Accounts Payable | 801.6 | 806.8 | 799.2 | 1,593.5 | 1,069.3 | 1,690.9 | 2,053.3 | 2,493.3 | 3,027.6 | 3,676.3 |
| Accounts Payable, % | 3.18 | 2.75 | 4.13 | 3.92 | 2.54 | 3.3 | 3.3 | 3.3 | 3.3 | 3.3 |
| Capital Expenditure | -5,027.0 | -3,452.9 | -1,098.6 | -1,490.4 | -1,179.8 | -4,488.9 | -5,450.8 | -6,618.9 | -8,037.3 | -9,759.6 |
| Capital Expenditure, % | -19.92 | -11.78 | -5.68 | -3.66 | -2.8 | -8.77 | -8.77 | -8.77 | -8.77 | -8.77 |
| Tax Rate, % | 25.39 | 25.39 | 25.39 | 25.39 | 25.39 | 25.39 | 25.39 | 25.39 | 25.39 | 25.39 |
| EBITAT | 5,586.9 | 7,360.8 | 1,003.7 | 13,332.9 | 14,097.5 | 11,716.9 | 14,227.7 | 17,276.6 | 20,978.9 | 25,474.5 |
| Depreciation | ||||||||||
| Changes in Account Receivables | ||||||||||
| Changes in Inventories | ||||||||||
| Changes in Accounts Payable | ||||||||||
| Capital Expenditure | ||||||||||
| UFCF | 4,680.1 | 11,642.8 | 5,420.9 | 17,868.2 | 17,897.1 | 17,741.0 | 21,215.5 | 25,761.8 | 31,282.4 | 37,986.0 |
| WACC, % | 4.61 | 4.59 | 4.45 | 4.58 | 4.58 | 4.56 | 4.56 | 4.56 | 4.56 | 4.56 |
| PV UFCF | ||||||||||
| SUM PV UFCF | 115,470.0 | |||||||||
| Long Term Growth Rate, % | 4.00 | |||||||||
| Free cash flow (T + 1) | 39,505 | |||||||||
| Terminal Value | 7,035,676 | |||||||||
| Present Terminal Value | 5,629,201 | |||||||||
| Enterprise Value | 5,744,671 | |||||||||
| Net Debt | 42,455 | |||||||||
| Equity Value | 5,702,216 | |||||||||
| Diluted Shares Outstanding, MM | 49,109 | |||||||||
| Equity Value Per Share | 116.11 |
What You'll Receive
- Customizable Excel Template: A tailored Excel-based DCF Calculator featuring pre-populated financial data for Beijing-Shanghai High-Speed Railway Co., Ltd. (601816SS).
- Accurate Historical Data: Access to past performance metrics and forward-looking projections (highlighted in the yellow cells).
- Adjustable Forecast Assumptions: Modify key inputs such as revenue growth, EBITDA %, and WACC as needed.
- Instant Calculations: Quickly visualize how your changes affect the valuation of Beijing-Shanghai High-Speed Railway Co., Ltd. (601816SS).
- Professional-Grade Tool: Designed for investors, CFOs, consultants, and financial analysts.
- User-Centric Interface: Organized for simplicity and ease of navigation, complete with step-by-step guidance.
Key Features
- Accurate Financial Data for Beijing-Shanghai High-Speed Railway: Gain access to reliable pre-loaded historical figures and future forecasts.
- Customizable Forecast Parameters: Modify highlighted fields, such as WACC, growth rates, and profit margins, to suit your analysis.
- Real-Time Updates: Enjoy automatic recalculations for DCF, Net Present Value (NPV), and cash flow assessments.
- User-Friendly Dashboard: View straightforward charts and summaries that make understanding your valuation results effortless.
- Designed for All Skill Levels: An intuitive framework tailored for investors, CFOs, and consultants alike.
How It Operates
- Step 1: Download the Excel file.
- Step 2: Examine the pre-filled data for Beijing-Shanghai High-Speed Railway (601816SS) including historical and projected figures.
- Step 3: Modify the key assumptions (highlighted in yellow) according to your findings.
- Step 4: Observe the automatic updates reflecting the intrinsic value of Beijing-Shanghai High-Speed Railway (601816SS).
- Step 5: Leverage the results for your investment choices or reporting needs.
Reasons to Choose Beijing-Shanghai High-Speed Railway Co.,Ltd. (601816SS)
- Time Efficiency: Instantly access comprehensive data without the need for complex models.
- Enhanced Precision: Utilize reliable financial figures and formulas to minimize valuation discrepancies.
- Fully Adjustable: Customize the analysis to align with your specific assumptions and forecasts.
- User-Friendly: Intuitive charts and outputs simplify the interpretation of results.
- Preferred by Professionals: Developed for experts who prioritize accuracy and functionality.
Who Should Use This Product?
- Individual Investors: Make informed decisions about buying or selling Beijing-Shanghai High-Speed Railway Co., Ltd. (601816SS).
- Financial Analysts: Enhance valuation processes with easy-to-access financial models tailored for the railway sector.
- Consultants: Provide expert valuation insights to clients efficiently and with high accuracy.
- Business Owners: Gain insights into the valuation of major firms like Beijing-Shanghai High-Speed Railway Co., Ltd. (601816SS) to inform your own business strategy.
- Finance Students: Acquire practical knowledge of valuation methods utilizing real-world data and examples from the transportation industry.
Contents of the Template
- Pre-Filled Data: Features historical financials and forecasts for Beijing-Shanghai High-Speed Railway Co., Ltd. (601816SS).
- Discounted Cash Flow Model: An editable DCF valuation model with automatic calculation features.
- Weighted Average Cost of Capital (WACC): A dedicated section for calculating WACC with adjustable inputs.
- Key Financial Ratios: Evaluate the profitability, efficiency, and leverage of Beijing-Shanghai High-Speed Railway Co., Ltd. (601816SS).
- Customizable Inputs: Easily modify revenue growth, margins, and tax rates as needed.
- Clear Dashboard: Visual representations including charts and tables summarizing important valuation outcomes.
Disclaimer
All information, articles, and product details provided on this website are for general informational and educational purposes only. We do not claim any ownership over, nor do we intend to infringe upon, any trademarks, copyrights, logos, brand names, or other intellectual property mentioned or depicted on this site. Such intellectual property remains the property of its respective owners, and any references here are made solely for identification or informational purposes, without implying any affiliation, endorsement, or partnership.
We make no representations or warranties, express or implied, regarding the accuracy, completeness, or suitability of any content or products presented. Nothing on this website should be construed as legal, tax, investment, financial, medical, or other professional advice. In addition, no part of this site—including articles or product references—constitutes a solicitation, recommendation, endorsement, advertisement, or offer to buy or sell any securities, franchises, or other financial instruments, particularly in jurisdictions where such activity would be unlawful.
All content is of a general nature and may not address the specific circumstances of any individual or entity. It is not a substitute for professional advice or services. Any actions you take based on the information provided here are strictly at your own risk. You accept full responsibility for any decisions or outcomes arising from your use of this website and agree to release us from any liability in connection with your use of, or reliance upon, the content or products found herein.