
|
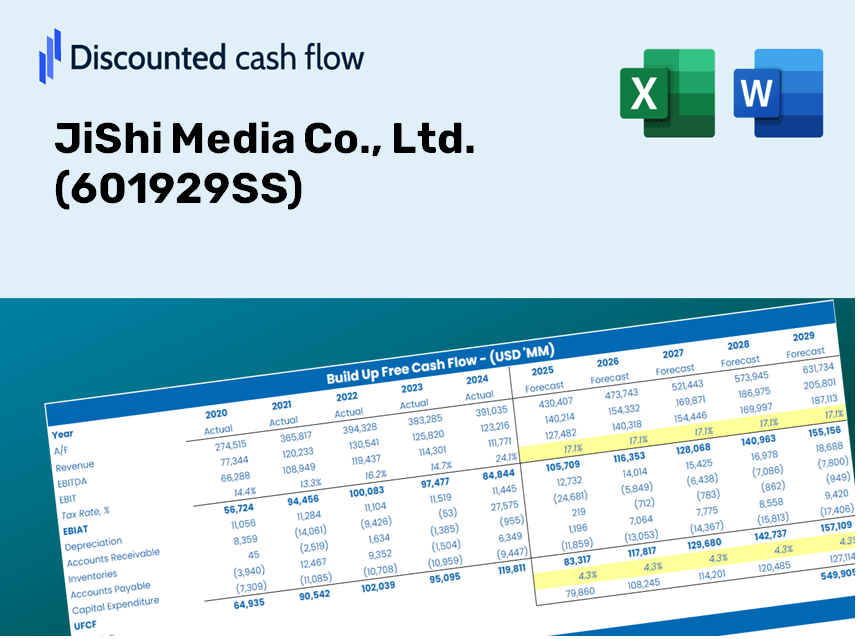
Jishi Media Co., Ltd. (601929.SS) Évaluation DCF |
Entièrement Modifiable: Adapté À Vos Besoins Dans Excel Ou Sheets
Conception Professionnelle: Modèles Fiables Et Conformes Aux Normes Du Secteur
Pré-Construits Pour Une Utilisation Rapide Et Efficace
Compatible MAC/PC, entièrement débloqué
Aucune Expertise N'Est Requise; Facile À Suivre
JiShi Media Co., Ltd. (601929.SS) Bundle
Conçu pour la précision, notre calculatrice DCF (601929SS) vous permet d'évaluer l'évaluation de Jishi Media Co., Ltd. à l'aide de données financières à jour, offrant une flexibilité complète pour modifier tous les paramètres essentiels pour des projections améliorées.
Benefits You Will Receive
- Comprehensive Financial Data for JiShi Media: Access to historical and projected financials for precise valuation.
- Customizable Inputs: Adjust factors like WACC, tax rates, revenue growth, and capital expenditures.
- Real-Time Calculations: Dynamic calculations of intrinsic value and NPV.
- Scenario Analysis: Explore various scenarios to assess JiShi Media's future prospects.
- User-Friendly Design: Tailored for industry experts while remaining easy for newcomers.
Key Features
- Real-Life JSM Data: Pre-filled with JiShi Media's historical financials and forward-looking projections.
- Fully Customizable Inputs: Adjust revenue growth, profit margins, WACC, tax rates, and capital expenditures.
- Dynamic Valuation Model: Automatic updates to Net Present Value (NPV) and intrinsic value based on your inputs.
- Scenario Testing: Create various forecast scenarios to analyze different valuation outcomes.
- User-Friendly Design: Intuitive, organized, and suitable for both professionals and newcomers.
How It Functions
- Download the Template: Gain immediate access to the Excel-based JiShi Media Co., Ltd. (601929SS) DCF Calculator.
- Input Your Assumptions: Modify the yellow-highlighted cells for growth rates, WACC, profit margins, and additional parameters.
- Instant Calculations: The model will automatically refresh to display JiShi Media's intrinsic value.
- Test Scenarios: Assess various assumptions to analyze potential changes in valuation.
- Analyze and Decide: Utilize the outcomes to inform your investment strategy or financial evaluation.
Why Select the JiShi Media Co., Ltd. Calculator?
- All-in-One Solution: Features complete DCF, WACC, and financial ratio assessments all in one convenient tool.
- Flexible Parameters: Modify the highlighted cells to explore different financial scenarios.
- In-Depth Analysis: Automatically computes the intrinsic value and Net Present Value for JiShi Media Co., Ltd. (601929SS).
- Preloaded Information: Access to both historical and projected data provides reliable benchmarks.
- High-Quality Standards: Perfectly suited for financial analysts, investors, and business advisors.
Who Can Benefit from JiShi Media Co., Ltd. (601929SS)?
- Investors: Evaluate JiShi Media's valuation to inform your stock trading decisions.
- CFOs and Financial Analysts: Optimize valuation methodologies and assess financial forecasts.
- Startup Founders: Understand the valuation practices of prominent media companies like JiShi Media.
- Consultants: Provide comprehensive valuation reports to your clients based on JiShi Media's performance.
- Students and Educators: Leverage real-time data to learn and teach valuation strategies.
Contents of the Template
- Pre-Filled DCF Model: JiShi Media Co., Ltd.’s financial data preloaded for instant application.
- WACC Calculator: Comprehensive calculations for Weighted Average Cost of Capital.
- Financial Ratios: Assess JiShi Media Co., Ltd.'s profitability, leverage, and efficiency metrics.
- Editable Inputs: Modify assumptions like growth rates, margins, and CAPEX to suit your analysis.
- Financial Statements: Access annual and quarterly reports for in-depth examination.
- Interactive Dashboard: Effortlessly visualize essential valuation metrics and outcomes.
Disclaimer
All information, articles, and product details provided on this website are for general informational and educational purposes only. We do not claim any ownership over, nor do we intend to infringe upon, any trademarks, copyrights, logos, brand names, or other intellectual property mentioned or depicted on this site. Such intellectual property remains the property of its respective owners, and any references here are made solely for identification or informational purposes, without implying any affiliation, endorsement, or partnership.
We make no representations or warranties, express or implied, regarding the accuracy, completeness, or suitability of any content or products presented. Nothing on this website should be construed as legal, tax, investment, financial, medical, or other professional advice. In addition, no part of this site—including articles or product references—constitutes a solicitation, recommendation, endorsement, advertisement, or offer to buy or sell any securities, franchises, or other financial instruments, particularly in jurisdictions where such activity would be unlawful.
All content is of a general nature and may not address the specific circumstances of any individual or entity. It is not a substitute for professional advice or services. Any actions you take based on the information provided here are strictly at your own risk. You accept full responsibility for any decisions or outcomes arising from your use of this website and agree to release us from any liability in connection with your use of, or reliance upon, the content or products found herein.