
|
Technopro Holdings, Inc. (6028.T) Valation DCF |
Entièrement Modifiable: Adapté À Vos Besoins Dans Excel Ou Sheets
Conception Professionnelle: Modèles Fiables Et Conformes Aux Normes Du Secteur
Pré-Construits Pour Une Utilisation Rapide Et Efficace
Compatible MAC/PC, entièrement débloqué
Aucune Expertise N'Est Requise; Facile À Suivre
TechnoPro Holdings, Inc. (6028.T) Bundle
Améliorez votre stratégie d'investissement avec la calculatrice (6028T) DCF! Passez en revue les données financières Authentic Techopro Holdings, Inc., ajustez les prévisions et les dépenses de croissance et observez comment ces modifications affectent la valeur intrinsèque de (6028T) en temps réel.
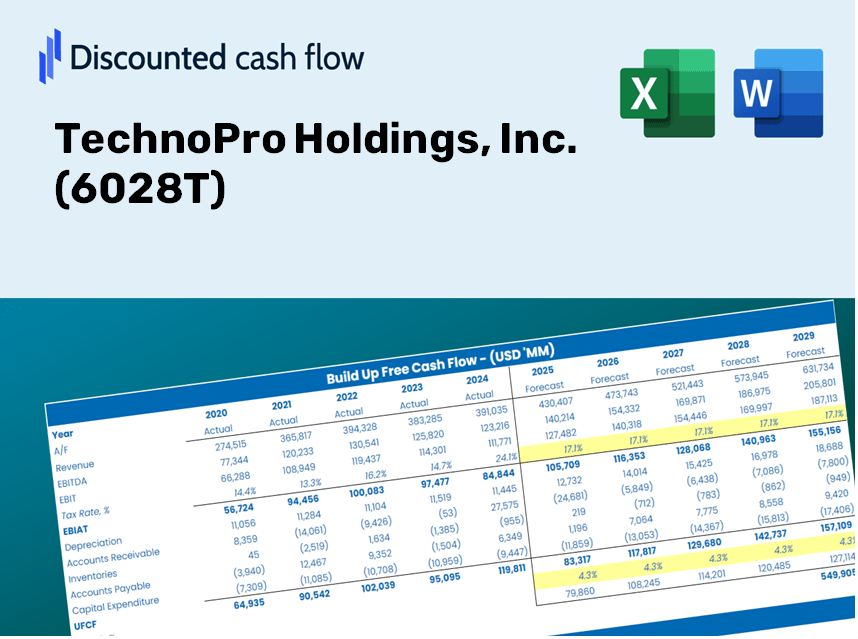
Discounted Cash Flow (DCF) - (USD MM)
| Year | AY1 2021 |
AY2 2022 |
AY3 2023 |
AY4 2024 |
AY5 2025 |
FY1 2026 |
FY2 2027 |
FY3 2028 |
FY4 2029 |
FY5 2030 |
|---|---|---|---|---|---|---|---|---|---|---|
| Revenue | 161,316.0 | 178,756.0 | 199,851.0 | 219,218.0 | 238,966.0 | 263,645.9 | 290,874.7 | 320,915.7 | 354,059.2 | 390,625.7 |
| Revenue Growth, % | 0 | 10.81 | 11.8 | 9.69 | 9.01 | 10.33 | 10.33 | 10.33 | 10.33 | 10.33 |
| EBITDA | 22,303.0 | 24,200.0 | 25,080.0 | 25,509.0 | 27,515.0 | 33,252.9 | 36,687.2 | 40,476.2 | 44,656.5 | 49,268.5 |
| EBITDA, % | 13.83 | 13.54 | 12.55 | 11.64 | 11.51 | 12.61 | 12.61 | 12.61 | 12.61 | 12.61 |
| Depreciation | 2,658.0 | 3,100.0 | 3,128.0 | 3,271.0 | 3,096.0 | 4,078.5 | 4,499.7 | 4,964.4 | 5,477.1 | 6,042.8 |
| Depreciation, % | 1.65 | 1.73 | 1.57 | 1.49 | 1.3 | 1.55 | 1.55 | 1.55 | 1.55 | 1.55 |
| EBIT | 19,645.0 | 21,100.0 | 21,952.0 | 22,238.0 | 24,419.0 | 29,174.4 | 32,187.5 | 35,511.8 | 39,179.3 | 43,225.7 |
| EBIT, % | 12.18 | 11.8 | 10.98 | 10.14 | 10.22 | 11.07 | 11.07 | 11.07 | 11.07 | 11.07 |
| Total Cash | 37,353.0 | 42,598.0 | 41,073.0 | 45,241.0 | 43,691.0 | 56,134.5 | 61,931.9 | 68,328.1 | 75,384.9 | 83,170.5 |
| Total Cash, percent | .0 | .0 | .0 | .0 | .0 | .0 | .0 | .0 | .0 | .0 |
| Account Receivables | 20,716.0 | 25,071.0 | 27,405.0 | 29,013.0 | 30,876.0 | 35,189.0 | 38,823.2 | 42,832.8 | 47,256.5 | 52,137.0 |
| Account Receivables, % | 12.84 | 14.03 | 13.71 | 13.23 | 12.92 | 13.35 | 13.35 | 13.35 | 13.35 | 13.35 |
| Inventories | .0 | .0 | .0 | .0 | .0 | .0 | .0 | .0 | .0 | .0 |
| Inventories, % | 0 | 0 | 0 | 0 | 0 | 0 | 0 | 0 | 0 | 0 |
| Accounts Payable | 129.0 | 238.0 | 141.0 | 18,117.0 | 19,779.0 | 8,871.7 | 9,787.9 | 10,798.8 | 11,914.1 | 13,144.5 |
| Accounts Payable, % | 0.07996727 | 0.13314 | 0.07055256 | 8.26 | 8.28 | 3.36 | 3.36 | 3.36 | 3.36 | 3.36 |
| Capital Expenditure | -351.0 | -692.0 | -708.0 | -607.0 | -411.0 | -742.3 | -819.0 | -903.6 | -996.9 | -1,099.9 |
| Capital Expenditure, % | -0.21759 | -0.38712 | -0.35426 | -0.27689 | -0.17199 | -0.28157 | -0.28157 | -0.28157 | -0.28157 | -0.28157 |
| Tax Rate, % | 33.46 | 33.46 | 33.46 | 33.46 | 33.46 | 33.46 | 33.46 | 33.46 | 33.46 | 33.46 |
| EBITAT | 13,362.7 | 15,527.9 | 15,445.9 | 14,749.7 | 16,247.5 | 20,120.9 | 22,198.9 | 24,491.6 | 27,021.0 | 29,811.7 |
| Depreciation | ||||||||||
| Changes in Account Receivables | ||||||||||
| Changes in Inventories | ||||||||||
| Changes in Accounts Payable | ||||||||||
| Capital Expenditure | ||||||||||
| UFCF | -4,917.3 | 13,689.9 | 15,434.9 | 33,781.7 | 18,731.5 | 8,236.7 | 23,161.6 | 25,553.7 | 28,192.8 | 31,104.5 |
| WACC, % | 10.86 | 10.87 | 10.86 | 10.86 | 10.86 | 10.86 | 10.86 | 10.86 | 10.86 | 10.86 |
| PV UFCF | ||||||||||
| SUM PV UFCF | 82,273.9 | |||||||||
| Long Term Growth Rate, % | 3.00 | |||||||||
| Free cash flow (T + 1) | 32,038 | |||||||||
| Terminal Value | 407,631 | |||||||||
| Present Terminal Value | 243,446 | |||||||||
| Enterprise Value | 325,720 | |||||||||
| Net Debt | -25,052 | |||||||||
| Equity Value | 350,772 | |||||||||
| Diluted Shares Outstanding, MM | 105 | |||||||||
| Equity Value Per Share | 3,355.74 |
What You Will Receive
- Customizable Forecast Inputs: Effortlessly adjust key assumptions (growth %, margins, WACC) to explore various scenarios.
- Industry-Specific Data: Pre-loaded financial data from TechnoPro Holdings, Inc. (6028T) to facilitate your analysis.
- Automated DCF Calculations: The template will compute the Net Present Value (NPV) and intrinsic value for you.
- Professional and Adaptable: A sleek Excel model that is tailored to meet your valuation requirements.
- Designed for Analysts and Investors: Perfect for evaluating projections, verifying strategies, and enhancing efficiency.
Key Features
- 🔍 Real-Life TechnoPro Financials: Pre-filled historical and projected data for TechnoPro Holdings, Inc. (6028T).
- ✏️ Fully Customizable Inputs: Modify all essential parameters (yellow cells) such as WACC, growth %, and tax rates.
- 📊 Professional DCF Valuation: Integrated formulas assess TechnoPro’s intrinsic value using the Discounted Cash Flow method.
- ⚡ Instant Results: View TechnoPro’s valuation immediately after adjustments.
- Scenario Analysis: Analyze and compare different financial assumptions side-by-side.
How It Works
- Step 1: Download the Excel file.
- Step 2: Review TechnoPro Holdings, Inc.'s pre-filled financial data and projections.
- Step 3: Adjust key inputs such as revenue growth, WACC, and tax rates (highlighted cells).
- Step 4: Observe the DCF model update in real-time as you modify your assumptions.
- Step 5: Evaluate the outputs and leverage the results for investment strategies.
Why Opt for TechnoPro Holdings, Inc. (6028T) Calculator?
- Time-Saving: Skip the hassle of building a DCF model from the ground up – it's pre-configured for your convenience.
- Enhanced Accuracy: Dependable financial data and formulas minimize valuation errors.
- Completely Customizable: Adjust the model to align with your specific assumptions and forecasts.
- User-Friendly: Intuitive charts and outputs ensure the results are straightforward to interpret.
- Endorsed by Professionals: Crafted for experts who prioritize both precision and functionality.
Who Can Benefit from This Product?
- Professional Investors: Create comprehensive and accurate valuation models for assessing portfolios with TechnoPro Holdings, Inc. (6028T).
- Corporate Finance Teams: Evaluate valuation scenarios to inform and shape internal strategies for TechnoPro Holdings, Inc. (6028T).
- Consultants and Advisors: Deliver precise valuation insights to clients focused on TechnoPro Holdings, Inc. (6028T).
- Students and Educators: Utilize real-world data to learn and teach financial modeling with a focus on TechnoPro Holdings, Inc. (6028T).
- Tech Enthusiasts: Gain a deeper understanding of how tech firms like TechnoPro Holdings, Inc. (6028T) are valued in the marketplace.
Contents of the Template
- Operating and Balance Sheet Data: Pre-filled historical data and forecasts for TechnoPro Holdings, Inc. (6028T), including metrics such as revenue, EBITDA, EBIT, and capital expenditures.
- WACC Calculation: A dedicated worksheet for the Weighted Average Cost of Capital (WACC), featuring parameters like Beta, risk-free rate, and share price.
- DCF Valuation (Unlevered and Levered): Customizable Discounted Cash Flow models that display intrinsic value along with detailed calculations.
- Financial Statements: Pre-loaded annual and quarterly financial statements to facilitate comprehensive analysis.
- Key Ratios: Includes key metrics for profitability, leverage, and efficiency specific to TechnoPro Holdings, Inc. (6028T).
- Dashboard and Charts: A visual summary capturing valuation outputs and assumptions for easy result analysis.
Disclaimer
All information, articles, and product details provided on this website are for general informational and educational purposes only. We do not claim any ownership over, nor do we intend to infringe upon, any trademarks, copyrights, logos, brand names, or other intellectual property mentioned or depicted on this site. Such intellectual property remains the property of its respective owners, and any references here are made solely for identification or informational purposes, without implying any affiliation, endorsement, or partnership.
We make no representations or warranties, express or implied, regarding the accuracy, completeness, or suitability of any content or products presented. Nothing on this website should be construed as legal, tax, investment, financial, medical, or other professional advice. In addition, no part of this site—including articles or product references—constitutes a solicitation, recommendation, endorsement, advertisement, or offer to buy or sell any securities, franchises, or other financial instruments, particularly in jurisdictions where such activity would be unlawful.
All content is of a general nature and may not address the specific circumstances of any individual or entity. It is not a substitute for professional advice or services. Any actions you take based on the information provided here are strictly at your own risk. You accept full responsibility for any decisions or outcomes arising from your use of this website and agree to release us from any liability in connection with your use of, or reliance upon, the content or products found herein.