
|
Shanxi Huaxiang Group Co., Ltd. (603112.SS) Évaluation DCF |
Entièrement Modifiable: Adapté À Vos Besoins Dans Excel Ou Sheets
Conception Professionnelle: Modèles Fiables Et Conformes Aux Normes Du Secteur
Pré-Construits Pour Une Utilisation Rapide Et Efficace
Compatible MAC/PC, entièrement débloqué
Aucune Expertise N'Est Requise; Facile À Suivre
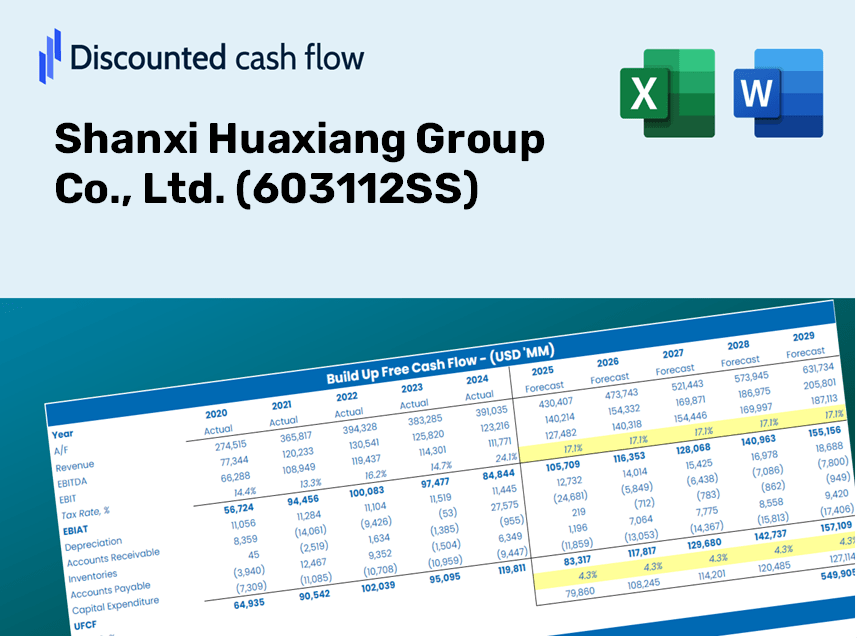
Shanxi Huaxiang Group Co., Ltd. (603112.SS) Bundle
Évaluez Shanxi Huaxiang Group Co., les perspectives financières de Ltd. comme un expert! Cette calculatrice DCF (603112SS) vous fournit des données financières pré-remplies tout en vous permettant un contrôle total pour modifier la croissance des revenus, le WACC, les marges et d'autres hypothèses cruciales pour s'aligner sur vos projections.
Discounted Cash Flow (DCF) - (USD MM)
| Year | AY1 2020 |
AY2 2021 |
AY3 2022 |
AY4 2023 |
AY5 2024 |
FY1 2025 |
FY2 2026 |
FY3 2027 |
FY4 2028 |
FY5 2029 |
|---|---|---|---|---|---|---|---|---|---|---|
| Revenue | 1,948.9 | 3,282.3 | 3,225.8 | 3,263.5 | 3,827.5 | 4,642.3 | 5,630.6 | 6,829.2 | 8,283.0 | 10,046.2 |
| Revenue Growth, % | 0 | 68.42 | -1.72 | 1.17 | 17.28 | 21.29 | 21.29 | 21.29 | 21.29 | 21.29 |
| EBITDA | 341.7 | 494.7 | 450.9 | 623.3 | 706.4 | 781.2 | 947.5 | 1,149.2 | 1,393.8 | 1,690.5 |
| EBITDA, % | 17.53 | 15.07 | 13.98 | 19.1 | 18.46 | 16.83 | 16.83 | 16.83 | 16.83 | 16.83 |
| Depreciation | 112.2 | 146.3 | 178.6 | 196.0 | 216.5 | 254.5 | 308.7 | 374.4 | 454.1 | 550.7 |
| Depreciation, % | 5.76 | 4.46 | 5.54 | 6 | 5.66 | 5.48 | 5.48 | 5.48 | 5.48 | 5.48 |
| EBIT | 229.5 | 348.4 | 272.3 | 427.4 | 489.9 | 526.7 | 638.8 | 774.8 | 939.8 | 1,139.8 |
| EBIT, % | 11.78 | 10.61 | 8.44 | 13.1 | 12.8 | 11.35 | 11.35 | 11.35 | 11.35 | 11.35 |
| Total Cash | 477.6 | 1,412.5 | 1,263.0 | 1,334.7 | 1,686.0 | 1,779.3 | 2,158.0 | 2,617.4 | 3,174.6 | 3,850.4 |
| Total Cash, percent | .0 | .0 | .0 | .0 | .0 | .0 | .0 | .0 | .0 | .0 |
| Account Receivables | 912.0 | 1,117.6 | 1,267.5 | 1,309.0 | 1,413.5 | 1,830.7 | 2,220.4 | 2,693.1 | 3,266.4 | 3,961.8 |
| Account Receivables, % | 46.79 | 34.05 | 39.29 | 40.11 | 36.93 | 39.44 | 39.44 | 39.44 | 39.44 | 39.44 |
| Inventories | 290.7 | 546.6 | 633.7 | 639.8 | 696.9 | 826.6 | 1,002.5 | 1,215.9 | 1,474.8 | 1,788.7 |
| Inventories, % | 14.91 | 16.65 | 19.64 | 19.61 | 18.21 | 17.8 | 17.8 | 17.8 | 17.8 | 17.8 |
| Accounts Payable | 425.6 | 890.8 | 902.0 | 638.0 | 583.4 | 1,037.4 | 1,258.2 | 1,526.1 | 1,850.9 | 2,244.9 |
| Accounts Payable, % | 21.84 | 27.14 | 27.96 | 19.55 | 15.24 | 22.35 | 22.35 | 22.35 | 22.35 | 22.35 |
| Capital Expenditure | -127.6 | -411.3 | -320.6 | -113.5 | -140.4 | -335.8 | -407.3 | -494.0 | -599.1 | -726.6 |
| Capital Expenditure, % | -6.55 | -12.53 | -9.94 | -3.48 | -3.67 | -7.23 | -7.23 | -7.23 | -7.23 | -7.23 |
| Tax Rate, % | 6.24 | 6.24 | 6.24 | 6.24 | 6.24 | 6.24 | 6.24 | 6.24 | 6.24 | 6.24 |
| EBITAT | 202.5 | 324.3 | 305.2 | 410.8 | 459.3 | 496.3 | 602.0 | 730.2 | 885.6 | 1,074.1 |
| Depreciation | ||||||||||
| Changes in Account Receivables | ||||||||||
| Changes in Inventories | ||||||||||
| Changes in Accounts Payable | ||||||||||
| Capital Expenditure | ||||||||||
| UFCF | -589.9 | 62.8 | -62.7 | 181.6 | 319.3 | 322.2 | 158.6 | 192.3 | 233.3 | 282.9 |
| WACC, % | 5.53 | 5.57 | 5.62 | 5.59 | 5.57 | 5.58 | 5.58 | 5.58 | 5.58 | 5.58 |
| PV UFCF | ||||||||||
| SUM PV UFCF | 1,014.3 | |||||||||
| Long Term Growth Rate, % | 3.50 | |||||||||
| Free cash flow (T + 1) | 293 | |||||||||
| Terminal Value | 14,102 | |||||||||
| Present Terminal Value | 10,750 | |||||||||
| Enterprise Value | 11,765 | |||||||||
| Net Debt | 1,223 | |||||||||
| Equity Value | 10,542 | |||||||||
| Diluted Shares Outstanding, MM | 461 | |||||||||
| Equity Value Per Share | 22.85 |
What You Will Receive
- Authentic SHX Financial Data: Pre-loaded with Shanxi Huaxiang Group Co., Ltd.’s historical and projected figures for thorough analysis.
- Completely Customizable Template: Easily adjust key parameters such as revenue growth, WACC, and EBITDA percentage.
- Instant Calculations: Watch the intrinsic value of SHX update in real-time as you make adjustments.
- Professional Valuation Tool: Tailored for investors, analysts, and consultants in pursuit of precise DCF outcomes.
- Intuitive Design: Streamlined layout and straightforward instructions suitable for all skill levels.
Key Features
- Comprehensive Historical Data: Access Shanxi Huaxiang Group Co., Ltd.'s (603112SS) financial statements and pre-filled projections.
- Customizable Parameters: Modify WACC, tax rates, revenue growth, and EBITDA margins as needed.
- Real-Time Insights: Watch the intrinsic value of Shanxi Huaxiang Group Co., Ltd. (603112SS) update instantly.
- Visual Analytics: Intuitive dashboard charts illustrate valuation results and essential metrics.
- Designed for Precision: A reliable tool suited for analysts, investors, and finance professionals.
How It Works
- Download: Obtain the pre-built Excel file featuring financial data for Shanxi Huaxiang Group Co., Ltd. (603112SS).
- Customize: Adjust key forecasts such as revenue growth, EBITDA %, and WACC to suit your analysis.
- Update Automatically: Enjoy real-time updates to intrinsic value and NPV calculations as you make changes.
- Test Scenarios: Generate various projections and instantly compare the results.
- Make Decisions: Leverage the valuation outputs to inform your investment strategy.
Why Opt for Shanxi Huaxiang Group Co., Ltd. ([603112SS])?
- All-In-One Solution: Combines DCF, WACC, and financial ratio analyses for a complete financial overview.
- Flexible Parameters: Modify yellow-highlighted fields to explore different financial scenarios.
- In-Depth Analysis: Automatically determines the intrinsic value and Net Present Value for Shanxi Huaxiang Group.
- Data-Rich: Comes with historical and projected data for reliable analysis.
- High-Caliber Tool: Perfect for financial analysts, investors, and business consultants seeking comprehensive insights.
Who Can Benefit from Shanxi Huaxiang Group Co., Ltd. (603112SS)?
- Investors: Gain confidence in your investment choices with a comprehensive evaluation tool tailored for Shanxi Huaxiang Group Co., Ltd. (603112SS).
- Financial Analysts: Enhance efficiency with a pre-designed DCF model that can be customized to fit your analysis.
- Consultants: Easily modify the template to suit client presentations or detailed reports on Shanxi Huaxiang Group Co., Ltd. (603112SS).
- Finance Enthusiasts: Expand your knowledge of valuation methods through real-world case studies related to Shanxi Huaxiang Group Co., Ltd. (603112SS).
- Educators and Students: Utilize this resource as a hands-on learning tool in finance courses focusing on Shanxi Huaxiang Group Co., Ltd. (603112SS).
Contents of the Template
- Operating and Balance Sheet Data: Pre-filled historical data and forecasts for Shanxi Huaxiang Group Co., Ltd. (603112SS), covering revenue, EBITDA, EBIT, and capital expenditures.
- WACC Calculation: A dedicated sheet for Weighted Average Cost of Capital (WACC), featuring parameters such as Beta, risk-free rate, and share price.
- DCF Valuation (Unlevered and Levered): Customizable Discounted Cash Flow models that illustrate intrinsic value with comprehensive calculations.
- Financial Statements: Pre-loaded annual and quarterly financial statements to bolster analysis.
- Key Ratios: Includes profitability, leverage, and efficiency ratios specific to Shanxi Huaxiang Group Co., Ltd. (603112SS).
- Dashboard and Charts: A visual overview of valuation outputs and assumptions to facilitate easy analysis of results.
Disclaimer
All information, articles, and product details provided on this website are for general informational and educational purposes only. We do not claim any ownership over, nor do we intend to infringe upon, any trademarks, copyrights, logos, brand names, or other intellectual property mentioned or depicted on this site. Such intellectual property remains the property of its respective owners, and any references here are made solely for identification or informational purposes, without implying any affiliation, endorsement, or partnership.
We make no representations or warranties, express or implied, regarding the accuracy, completeness, or suitability of any content or products presented. Nothing on this website should be construed as legal, tax, investment, financial, medical, or other professional advice. In addition, no part of this site—including articles or product references—constitutes a solicitation, recommendation, endorsement, advertisement, or offer to buy or sell any securities, franchises, or other financial instruments, particularly in jurisdictions where such activity would be unlawful.
All content is of a general nature and may not address the specific circumstances of any individual or entity. It is not a substitute for professional advice or services. Any actions you take based on the information provided here are strictly at your own risk. You accept full responsibility for any decisions or outcomes arising from your use of this website and agree to release us from any liability in connection with your use of, or reliance upon, the content or products found herein.