
|
Beijing Yuanliu Hongyuan Electronic Technology Co., Ltd. (603267.SS) Valation DCF |
Entièrement Modifiable: Adapté À Vos Besoins Dans Excel Ou Sheets
Conception Professionnelle: Modèles Fiables Et Conformes Aux Normes Du Secteur
Pré-Construits Pour Une Utilisation Rapide Et Efficace
Compatible MAC/PC, entièrement débloqué
Aucune Expertise N'Est Requise; Facile À Suivre
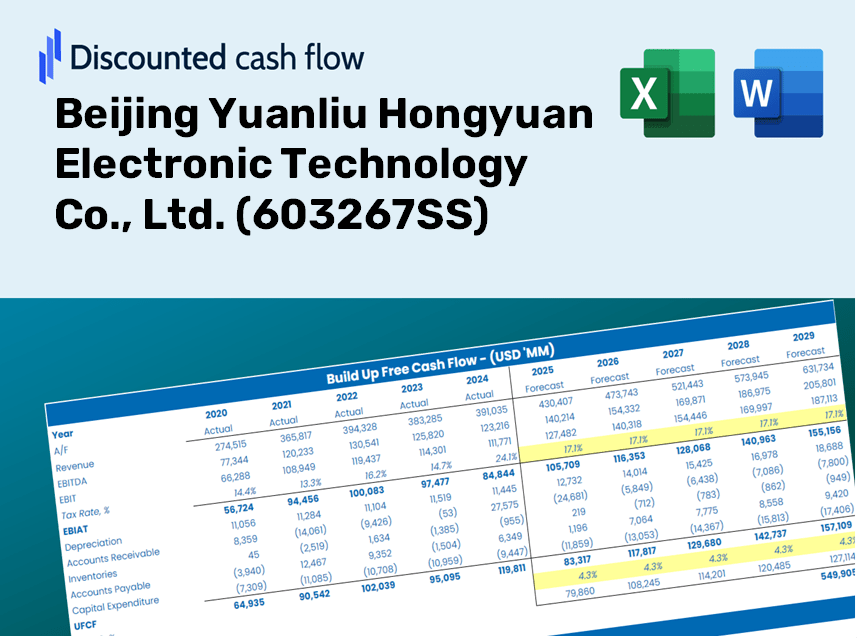
Beijing Yuanliu Hongyuan Electronic Technology Co., Ltd. (603267.SS) Bundle
Explorez l'avenir financier de Beijing Yuanliu Hongyuan Electronic Technology Co., Ltd. (603267SS) avec notre calculatrice DCF conviviale! Entrez vos projections pour la croissance, les marges et les dépenses pour calculer la valeur intrinsèque de Beijing Yuanliu Hongyuan Electronic Technology Co., Ltd. (603267SS) et affinez votre stratégie d'investissement.
Discounted Cash Flow (DCF) - (USD MM)
| Year | AY1 2020 |
AY2 2021 |
AY3 2022 |
AY4 2023 |
AY5 2024 |
FY1 2025 |
FY2 2026 |
FY3 2027 |
FY4 2028 |
FY5 2029 |
|---|---|---|---|---|---|---|---|---|---|---|
| Revenue | 1,700.0 | 2,403.1 | 2,502.2 | 1,675.8 | 1,491.8 | 1,497.3 | 1,502.8 | 1,508.4 | 1,513.9 | 1,519.5 |
| Revenue Growth, % | 0 | 41.36 | 4.12 | -33.02 | -10.98 | 0.36824 | 0.36824 | 0.36824 | 0.36824 | 0.36824 |
| EBITDA | 599.6 | 1,023.5 | 1,017.2 | 408.3 | 261.9 | 480.4 | 482.2 | 484.0 | 485.8 | 487.6 |
| EBITDA, % | 35.27 | 42.59 | 40.65 | 24.36 | 17.56 | 32.09 | 32.09 | 32.09 | 32.09 | 32.09 |
| Depreciation | 20.4 | 35.9 | 57.1 | 71.3 | 73.8 | 42.4 | 42.6 | 42.8 | 42.9 | 43.1 |
| Depreciation, % | 1.2 | 1.49 | 2.28 | 4.25 | 4.94 | 2.83 | 2.83 | 2.83 | 2.83 | 2.83 |
| EBIT | 579.3 | 987.6 | 960.1 | 337.0 | 188.1 | 438.0 | 439.6 | 441.2 | 442.9 | 444.5 |
| EBIT, % | 34.07 | 41.1 | 38.37 | 20.11 | 12.61 | 29.25 | 29.25 | 29.25 | 29.25 | 29.25 |
| Total Cash | 884.9 | 1,231.0 | 1,448.1 | 1,693.5 | 1,652.9 | 1,081.5 | 1,085.5 | 1,089.5 | 1,093.5 | 1,097.5 |
| Total Cash, percent | .0 | .0 | .0 | .0 | .0 | .0 | .0 | .0 | .0 | .0 |
| Account Receivables | 1,568.3 | 1,914.3 | 2,234.4 | 1,791.1 | 1,615.4 | 1,381.1 | 1,386.2 | 1,391.3 | 1,396.4 | 1,401.6 |
| Account Receivables, % | 92.25 | 79.66 | 89.3 | 106.88 | 108.29 | 92.24 | 92.24 | 92.24 | 92.24 | 92.24 |
| Inventories | 214.6 | 414.8 | 671.7 | 812.1 | 796.6 | 474.9 | 476.7 | 478.4 | 480.2 | 481.9 |
| Inventories, % | 12.62 | 17.26 | 26.85 | 48.46 | 53.4 | 31.72 | 31.72 | 31.72 | 31.72 | 31.72 |
| Accounts Payable | 186.9 | 228.9 | 574.9 | 384.4 | 413.9 | 282.0 | 283.1 | 284.1 | 285.2 | 286.2 |
| Accounts Payable, % | 11 | 9.53 | 22.98 | 22.94 | 27.74 | 18.84 | 18.84 | 18.84 | 18.84 | 18.84 |
| Capital Expenditure | -163.9 | -227.3 | -228.7 | -90.0 | -98.5 | -120.4 | -120.9 | -121.3 | -121.8 | -122.2 |
| Capital Expenditure, % | -9.64 | -9.46 | -9.14 | -5.37 | -6.61 | -8.04 | -8.04 | -8.04 | -8.04 | -8.04 |
| Tax Rate, % | 12.23 | 12.23 | 12.23 | 12.23 | 12.23 | 12.23 | 12.23 | 12.23 | 12.23 | 12.23 |
| EBITAT | 490.9 | 845.5 | 826.8 | 295.8 | 165.1 | 378.4 | 379.8 | 381.2 | 382.6 | 384.0 |
| Depreciation | ||||||||||
| Changes in Account Receivables | ||||||||||
| Changes in Inventories | ||||||||||
| Changes in Accounts Payable | ||||||||||
| Capital Expenditure | ||||||||||
| UFCF | -1,248.7 | 149.9 | 424.0 | 389.4 | 361.1 | 724.5 | 295.7 | 296.8 | 297.9 | 299.0 |
| WACC, % | 5.04 | 5.04 | 5.04 | 5.04 | 5.04 | 5.04 | 5.04 | 5.04 | 5.04 | 5.04 |
| PV UFCF | ||||||||||
| SUM PV UFCF | 1,692.5 | |||||||||
| Long Term Growth Rate, % | 2.00 | |||||||||
| Free cash flow (T + 1) | 305 | |||||||||
| Terminal Value | 10,035 | |||||||||
| Present Terminal Value | 7,848 | |||||||||
| Enterprise Value | 9,540 | |||||||||
| Net Debt | -703 | |||||||||
| Equity Value | 10,243 | |||||||||
| Diluted Shares Outstanding, MM | 231 | |||||||||
| Equity Value Per Share | 44.42 |
What You Will Receive
- Editable Excel Template: A fully customizable Excel-based DCF Calculator featuring pre-loaded financials for Beijing Yuanliu Hongyuan Electronic Technology Co., Ltd. (603267SS).
- Real-World Data: Access to historical data and forward-looking projections (highlighted in the yellow cells).
- Forecast Flexibility: Adjust forecast parameters such as revenue growth, EBITDA %, and WACC as needed.
- Automatic Calculations: Instantly view how your inputs affect the valuation of Beijing Yuanliu Hongyuan Electronic Technology Co., Ltd. (603267SS).
- Professional Tool: Designed specifically for investors, CFOs, consultants, and financial analysts.
- User-Friendly Interface: Organized for clarity and simplicity, complete with step-by-step guidance.
Key Features
- Real-Time Data for Beijing Yuanliu Hongyuan: Equipped with the company's historical performance metrics and future projections.
- Customizable Input Options: Tailor parameters such as revenue growth, profit margins, discount rates, tax implications, and capital expenditures to suit your analysis.
- Interactive Valuation Framework: Instantaneous calculations of Net Present Value (NPV) and intrinsic value reflecting your customized inputs.
- Scenario Analysis: Develop various forecasting scenarios to evaluate distinct valuation results.
- Intuitive User Interface: Designed for ease of use, catering to both seasoned professionals and newcomers.
How It Operates
- Download: Obtain the comprehensive Excel file featuring Beijing Yuanliu Hongyuan Electronic Technology Co., Ltd.'s (603267SS) financial data.
- Customize: Modify forecasts such as revenue growth rates, EBITDA percentages, and WACC values.
- Real-Time Updates: Watch as the intrinsic value and NPV calculations refresh automatically.
- Scenario Testing: Formulate various projections and instantly compare their results.
- Informed Decisions: Leverage the valuation outcomes to shape your investment approach.
Why Opt for This Calculator?
- Reliable Data: Utilize authentic financial figures for Beijing Yuanliu Hongyuan Electronic Technology Co., Ltd. to achieve trustworthy valuation insights.
- Flexible Customization: Modify essential variables such as growth projections, WACC, and tax rates to align with your financial forecasts.
- Efficiency Boost: Pre-configured calculations save you time, allowing you to focus on analysis rather than setup.
- Expert-Level Instrument: Tailored for investors, analysts, and consultants seeking detailed insights.
- Easy to Use: User-friendly design and clear, step-by-step guidance ensure accessibility for everyone.
Who Can Benefit from Our Solutions?
- Investors: Gain the insights you need to make informed decisions with our advanced valuation solutions.
- Financial Analysts: Streamline your workflow with our customizable DCF model tailored for efficiency.
- Consultants: Effortlessly modify our templates for impactful client presentations and reports.
- Finance Enthusiasts: Enhance your knowledge of valuation methodologies through practical, real-world applications.
- Educators and Students: Leverage our tool as a valuable resource for finance education and practical learning.
What the Template Contains
- Comprehensive DCF Model: Editable template featuring thorough valuation calculations.
- Real-World Data: Historical and projected financials for Beijing Yuanliu Hongyuan Electronic Technology Co., Ltd. (603267SS) preloaded for in-depth analysis.
- Customizable Parameters: Adjust WACC, growth rates, and tax assumptions to explore various scenarios.
- Financial Statements: Detailed annual and quarterly breakdowns for enhanced insights.
- Key Ratios: Integrated analysis covering profitability, efficiency, and leverage metrics.
- Dashboard with Visual Outputs: Visual charts and tables providing clear, actionable results.
Disclaimer
All information, articles, and product details provided on this website are for general informational and educational purposes only. We do not claim any ownership over, nor do we intend to infringe upon, any trademarks, copyrights, logos, brand names, or other intellectual property mentioned or depicted on this site. Such intellectual property remains the property of its respective owners, and any references here are made solely for identification or informational purposes, without implying any affiliation, endorsement, or partnership.
We make no representations or warranties, express or implied, regarding the accuracy, completeness, or suitability of any content or products presented. Nothing on this website should be construed as legal, tax, investment, financial, medical, or other professional advice. In addition, no part of this site—including articles or product references—constitutes a solicitation, recommendation, endorsement, advertisement, or offer to buy or sell any securities, franchises, or other financial instruments, particularly in jurisdictions where such activity would be unlawful.
All content is of a general nature and may not address the specific circumstances of any individual or entity. It is not a substitute for professional advice or services. Any actions you take based on the information provided here are strictly at your own risk. You accept full responsibility for any decisions or outcomes arising from your use of this website and agree to release us from any liability in connection with your use of, or reliance upon, the content or products found herein.