
|
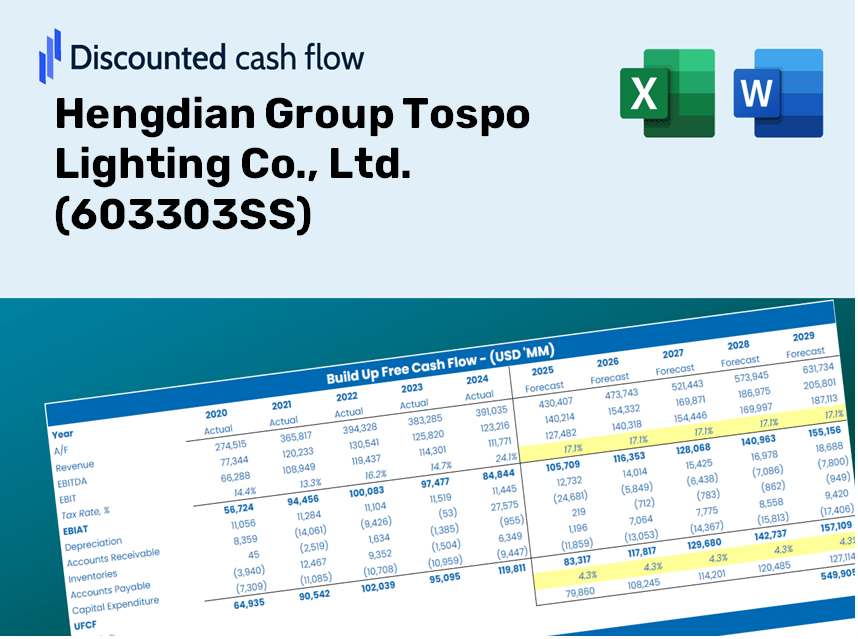
Hengdian Group Tospo Lighting Co., Ltd. (603303.SS) Évaluation DCF |
Entièrement Modifiable: Adapté À Vos Besoins Dans Excel Ou Sheets
Conception Professionnelle: Modèles Fiables Et Conformes Aux Normes Du Secteur
Pré-Construits Pour Une Utilisation Rapide Et Efficace
Compatible MAC/PC, entièrement débloqué
Aucune Expertise N'Est Requise; Facile À Suivre
Hengdian Group Tospo Lighting Co., Ltd. (603303.SS) Bundle
Conçu pour la précision, notre calculatrice DCF (603303SS) vous permet d'évaluer l'évaluation du groupe Hengdian Tospo Lighting Co., Ltd. à l'aide de données financières réelles, offrant une flexibilité complète pour modifier tous les paramètres essentiels pour des projections améliorées.
Discounted Cash Flow (DCF) - (USD MM)
| Year | AY1 2020 |
AY2 2021 |
AY3 2022 |
AY4 2023 |
AY5 2024 |
FY1 2025 |
FY2 2026 |
FY3 2027 |
FY4 2028 |
FY5 2029 |
|---|---|---|---|---|---|---|---|---|---|---|
| Revenue | 4,507.5 | 5,273.1 | 4,656.9 | 4,697.0 | 4,431.2 | 4,436.7 | 4,442.3 | 4,447.8 | 4,453.4 | 4,459.0 |
| Revenue Growth, % | 0 | 16.98 | -11.69 | 0.86091 | -5.66 | 0.1251 | 0.1251 | 0.1251 | 0.1251 | 0.1251 |
| EBITDA | 448.8 | 453.9 | 511.7 | 594.4 | 535.2 | 481.7 | 482.3 | 482.9 | 483.5 | 484.1 |
| EBITDA, % | 9.96 | 8.61 | 10.99 | 12.65 | 12.08 | 10.86 | 10.86 | 10.86 | 10.86 | 10.86 |
| Depreciation | 64.7 | 86.6 | 123.8 | 121.6 | 118.5 | 97.6 | 97.7 | 97.8 | 98.0 | 98.1 |
| Depreciation, % | 1.43 | 1.64 | 2.66 | 2.59 | 2.67 | 2.2 | 2.2 | 2.2 | 2.2 | 2.2 |
| EBIT | 384.1 | 367.3 | 387.8 | 472.8 | 416.7 | 384.1 | 384.6 | 385.0 | 385.5 | 386.0 |
| EBIT, % | 8.52 | 6.96 | 8.33 | 10.07 | 9.4 | 8.66 | 8.66 | 8.66 | 8.66 | 8.66 |
| Total Cash | 1,347.0 | 1,149.1 | 1,712.0 | 2,486.7 | 2,818.3 | 1,818.9 | 1,821.2 | 1,823.4 | 1,825.7 | 1,828.0 |
| Total Cash, percent | .0 | .0 | .0 | .0 | .0 | .0 | .0 | .0 | .0 | .0 |
| Account Receivables | 1,297.8 | 1,674.1 | 1,241.8 | 1,190.5 | 1,213.5 | 1,241.7 | 1,243.3 | 1,244.9 | 1,246.4 | 1,248.0 |
| Account Receivables, % | 28.79 | 31.75 | 26.67 | 25.35 | 27.39 | 27.99 | 27.99 | 27.99 | 27.99 | 27.99 |
| Inventories | 689.6 | 822.6 | 653.8 | 527.0 | 481.6 | 594.8 | 595.5 | 596.2 | 597.0 | 597.7 |
| Inventories, % | 15.3 | 15.6 | 14.04 | 11.22 | 10.87 | 13.41 | 13.41 | 13.41 | 13.41 | 13.41 |
| Accounts Payable | 1,048.1 | 1,440.1 | 1,299.0 | 1,699.2 | 1,976.0 | 1,412.9 | 1,414.6 | 1,416.4 | 1,418.2 | 1,420.0 |
| Accounts Payable, % | 23.25 | 27.31 | 27.89 | 36.18 | 44.59 | 31.84 | 31.84 | 31.84 | 31.84 | 31.84 |
| Capital Expenditure | -159.9 | -156.7 | -156.4 | -107.9 | -89.7 | -126.0 | -126.2 | -126.3 | -126.5 | -126.6 |
| Capital Expenditure, % | -3.55 | -2.97 | -3.36 | -2.3 | -2.02 | -2.84 | -2.84 | -2.84 | -2.84 | -2.84 |
| Tax Rate, % | 11.39 | 11.39 | 11.39 | 11.39 | 11.39 | 11.39 | 11.39 | 11.39 | 11.39 | 11.39 |
| EBITAT | 340.6 | 329.7 | 357.8 | 401.9 | 369.2 | 341.3 | 341.7 | 342.2 | 342.6 | 343.0 |
| Depreciation | ||||||||||
| Changes in Account Receivables | ||||||||||
| Changes in Inventories | ||||||||||
| Changes in Accounts Payable | ||||||||||
| Capital Expenditure | ||||||||||
| UFCF | -693.9 | 142.3 | 785.4 | 993.9 | 697.2 | -391.6 | 312.8 | 313.2 | 313.6 | 314.0 |
| WACC, % | 4.93 | 4.93 | 4.94 | 4.91 | 4.93 | 4.93 | 4.93 | 4.93 | 4.93 | 4.93 |
| PV UFCF | ||||||||||
| SUM PV UFCF | 687.6 | |||||||||
| Long Term Growth Rate, % | 3.50 | |||||||||
| Free cash flow (T + 1) | 325 | |||||||||
| Terminal Value | 22,782 | |||||||||
| Present Terminal Value | 17,913 | |||||||||
| Enterprise Value | 18,600 | |||||||||
| Net Debt | -2,767 | |||||||||
| Equity Value | 21,367 | |||||||||
| Diluted Shares Outstanding, MM | 472 | |||||||||
| Equity Value Per Share | 45.24 |
What You Will Receive
- Modifiable Forecast Inputs: Effortlessly adjust key assumptions (growth %, margins, WACC) to explore various scenarios.
- Industry-Specific Data: Hengdian Group Tospo Lighting Co., Ltd.'s financial figures pre-loaded to facilitate your analysis.
- Automatic DCF Calculations: The template computes Net Present Value (NPV) and intrinsic value automatically.
- Tailored and Professional: A refined Excel model that aligns with your valuation requirements.
- Designed for Analysts and Investors: Perfect for evaluating projections, confirming strategies, and enhancing efficiency.
Core Features
- Customizable Forecast Inputs: Adjust essential metrics such as revenue growth, EBITDA margins, and capital investments for precise projections.
- Instant DCF Valuation: Automatically computes intrinsic value, NPV, and additional key metrics in real time.
- High Precision Accuracy: Leverages Hengdian Group Tospo Lighting's real financial data for reliable valuation results.
- Effortless Scenario Testing: Easily experiment with various assumptions and analyze the resulting impacts.
- Efficiency Booster: Remove the hassle of constructing intricate valuation models from the ground up.
How It Functions
- Step 1: Download the Excel spreadsheet.
- Step 2: Examine Hengdian Group Tospo Lighting Co., Ltd.'s pre-filled financial information and projections.
- Step 3: Adjust key inputs such as revenue growth, WACC, and tax rates (highlighted cells).
- Step 4: Observe the DCF model refresh in real-time as you modify your assumptions.
- Step 5: Evaluate the results and leverage the findings for your investment strategies.
Why Opt for This Calculator?
- Designed for Experts: A sophisticated tool favored by industry analysts, CFOs, and consultants.
- Accurate Financials: Hengdian Group Tospo Lighting Co., Ltd.'s historical and projected financial data is preloaded for precision.
- Forecast Scenarios: Effortlessly simulate various forecasts and assumptions.
- Intuitive Results: Automatically generates intrinsic value, NPV, and essential metrics.
- User-Friendly: Step-by-step guidance makes navigating the tool simple.
Who Can Benefit from This Solution?
- Investors: Assess the market valuation of Hengdian Group Tospo Lighting Co., Ltd. (603303SS) prior to making investment decisions.
- CFOs and Financial Analysts: Enhance the efficiency of valuation methodologies and evaluate financial projections.
- Startup Founders: Gain insights on how established companies like Hengdian Group Tospo Lighting Co., Ltd. (603303SS) are appraised.
- Consultants: Create comprehensive valuation reports tailored for clients' needs.
- Students and Educators: Utilize current data to teach and practice valuation strategies effectively.
Contents of the Template
- Preloaded Hengdian Group Tospo Lighting Data: Historical and projected financial metrics, including revenue, EBIT, and capital expenditures.
- DCF and WACC Models: Professional-grade spreadsheets designed for calculating intrinsic value and Weighted Average Cost of Capital.
- Editable Inputs: Yellow-highlighted cells for modifying revenue growth, tax rates, and discount rates.
- Financial Statements: Detailed annual and quarterly financial statements for in-depth analysis.
- Key Ratios: Profitability, leverage, and efficiency ratios to assess company performance.
- Dashboard and Charts: Visual representations of valuation results and underlying assumptions.
Disclaimer
All information, articles, and product details provided on this website are for general informational and educational purposes only. We do not claim any ownership over, nor do we intend to infringe upon, any trademarks, copyrights, logos, brand names, or other intellectual property mentioned or depicted on this site. Such intellectual property remains the property of its respective owners, and any references here are made solely for identification or informational purposes, without implying any affiliation, endorsement, or partnership.
We make no representations or warranties, express or implied, regarding the accuracy, completeness, or suitability of any content or products presented. Nothing on this website should be construed as legal, tax, investment, financial, medical, or other professional advice. In addition, no part of this site—including articles or product references—constitutes a solicitation, recommendation, endorsement, advertisement, or offer to buy or sell any securities, franchises, or other financial instruments, particularly in jurisdictions where such activity would be unlawful.
All content is of a general nature and may not address the specific circumstances of any individual or entity. It is not a substitute for professional advice or services. Any actions you take based on the information provided here are strictly at your own risk. You accept full responsibility for any decisions or outcomes arising from your use of this website and agree to release us from any liability in connection with your use of, or reliance upon, the content or products found herein.