
|
Sichuan Teway Food Group Co., Ltd (603317.SS) Évaluation DCF |
Entièrement Modifiable: Adapté À Vos Besoins Dans Excel Ou Sheets
Conception Professionnelle: Modèles Fiables Et Conformes Aux Normes Du Secteur
Pré-Construits Pour Une Utilisation Rapide Et Efficace
Compatible MAC/PC, entièrement débloqué
Aucune Expertise N'Est Requise; Facile À Suivre
Sichuan Teway Food Group Co.,Ltd (603317.SS) Bundle
Découvrez le véritable potentiel de Sichuan Teway Food Group Co., Ltd (603317SS) avec notre calculatrice avancée DCF! Ajustez les hypothèses clés, explorez divers scénarios et évaluez comment les changements affectent l'évaluation de Sichuan Teway - le tout dans un modèle Excel complet.
What You Will Receive
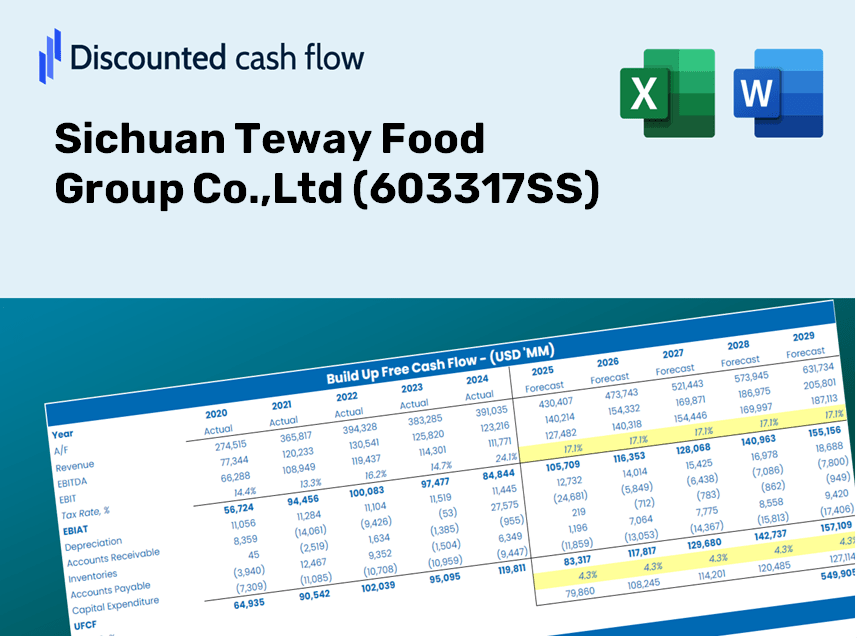
- Pre-Filled Financial Model: Utilize Sichuan Teway Food Group Co.,Ltd’s (603317SS) actual data for an accurate DCF valuation.
- Comprehensive Forecast Control: Modify revenue growth, profit margins, WACC, and other essential parameters.
- Real-Time Calculations: Instant updates provide you with live results as you make adjustments.
- Professional-Grade Template: A polished Excel file crafted for high-quality valuation analysis.
- Customizable and Reusable: Designed for adaptability, allowing for consistent use in detailed forecasting.
Key Features
- 🔍 Real-Life (603317SS) Financials: Pre-filled historical and projected data for Sichuan Teway Food Group Co., Ltd.
- ✏️ Fully Customizable Inputs: Modify all essential parameters (yellow cells) such as WACC, growth %, and tax rates.
- 📊 Professional DCF Valuation: Integrated formulas compute the intrinsic value of (603317SS) using the Discounted Cash Flow method.
- ⚡ Instant Results: See the valuation for (603317SS) immediately after making any adjustments.
- Scenario Analysis: Evaluate and compare outcomes for different financial assumptions side-by-side.
How It Works
- Step 1: Download the Excel file.
- Step 2: Explore Sichuan Teway Food Group Co., Ltd's (603317SS) pre-filled financial data and projections.
- Step 3: Adjust key parameters such as revenue growth, WACC, and tax rates (highlighted cells).
- Step 4: Observe the DCF model update in real-time as you modify your assumptions.
- Step 5: Evaluate the results and utilize the findings for your investment decisions.
Why Choose This Calculator for Sichuan Teway Food Group Co., Ltd (603317SS)?
- Accurate Data: Access to real financials for Sichuan Teway ensures dependable valuation outcomes.
- Customizable: Tailor essential inputs such as growth rates, WACC, and tax rates to fit your specific forecasts.
- Time-Saving: Built-in calculations save you the trouble of starting from scratch.
- Professional-Grade Tool: Perfectly crafted for investors, analysts, and consultants in the food industry.
- User-Friendly: The intuitive design and clear step-by-step guidance cater to users of all experience levels.
Who Should Utilize This Product?
- Professional Investors: Develop comprehensive and trustworthy valuation models for assessing portfolios.
- Corporate Finance Teams: Evaluate valuation scenarios to inform strategic decision-making.
- Consultants and Advisors: Deliver precise valuation insights for Sichuan Teway Food Group Co.,Ltd (603317SS) to clients.
- Students and Educators: Leverage real-world data for practicing and teaching financial modeling techniques.
- Food Industry Enthusiasts: Gain insights into how companies like Sichuan Teway Food Group Co.,Ltd (603317SS) are appraised in the market.
What the Template Includes
- In-Depth DCF Model: Editable framework featuring comprehensive valuation calculations.
- Real-World Data: Sichuan Teway Food Group's historical and projected financials preloaded for analysis.
- Customizable Parameters: Modify WACC, growth rates, and tax assumptions to explore various scenarios.
- Financial Statements: Complete annual and quarterly breakdowns for extensive insights.
- Key Ratios: Integrated analysis for assessing profitability, efficiency, and leverage.
- Dashboard with Visual Outputs: Charts and tables providing clear, actionable results.
Disclaimer
All information, articles, and product details provided on this website are for general informational and educational purposes only. We do not claim any ownership over, nor do we intend to infringe upon, any trademarks, copyrights, logos, brand names, or other intellectual property mentioned or depicted on this site. Such intellectual property remains the property of its respective owners, and any references here are made solely for identification or informational purposes, without implying any affiliation, endorsement, or partnership.
We make no representations or warranties, express or implied, regarding the accuracy, completeness, or suitability of any content or products presented. Nothing on this website should be construed as legal, tax, investment, financial, medical, or other professional advice. In addition, no part of this site—including articles or product references—constitutes a solicitation, recommendation, endorsement, advertisement, or offer to buy or sell any securities, franchises, or other financial instruments, particularly in jurisdictions where such activity would be unlawful.
All content is of a general nature and may not address the specific circumstances of any individual or entity. It is not a substitute for professional advice or services. Any actions you take based on the information provided here are strictly at your own risk. You accept full responsibility for any decisions or outcomes arising from your use of this website and agree to release us from any liability in connection with your use of, or reliance upon, the content or products found herein.