
|
Hunan Oil Pump Co., Ltd. (603319.SS) Évaluation DCF |
Entièrement Modifiable: Adapté À Vos Besoins Dans Excel Ou Sheets
Conception Professionnelle: Modèles Fiables Et Conformes Aux Normes Du Secteur
Pré-Construits Pour Une Utilisation Rapide Et Efficace
Compatible MAC/PC, entièrement débloqué
Aucune Expertise N'Est Requise; Facile À Suivre
Hunan Oil Pump Co., Ltd. (603319.SS) Bundle
Streamline Hunan Oil Pump Co., Ltd. (603319SS) Évaluation avec cette calculatrice DCF personnalisable! Équipés de Real Hunan Oil Pump Co., Ltd. (603319SS) Financials and Adjustable Prévisions, vous pouvez évaluer les scénarios et déterminer la juste valeur de Hunan Oil Pump Co., Ltd. (603319SS) en quelques minutes.
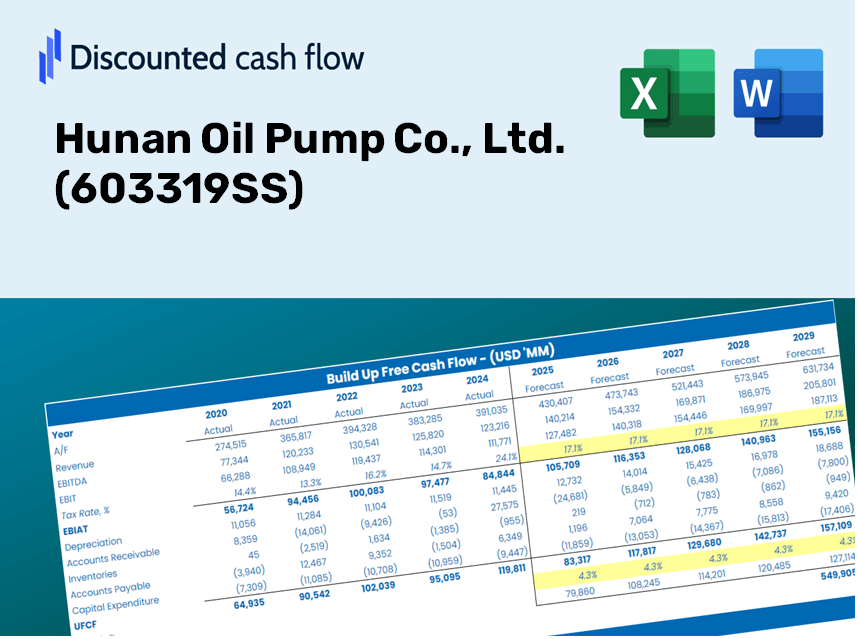
Discounted Cash Flow (DCF) - (USD MM)
| Year | AY1 2020 |
AY2 2021 |
AY3 2022 |
AY4 2023 |
AY5 2024 |
FY1 2025 |
FY2 2026 |
FY3 2027 |
FY4 2028 |
FY5 2029 |
|---|---|---|---|---|---|---|---|---|---|---|
| Revenue | 1,409.0 | 1,622.0 | 1,624.4 | 1,907.7 | 1,977.4 | 2,157.1 | 2,353.1 | 2,567.0 | 2,800.3 | 3,054.8 |
| Revenue Growth, % | 0 | 15.11 | 0.14972 | 17.44 | 3.65 | 9.09 | 9.09 | 9.09 | 9.09 | 9.09 |
| EBITDA | 241.4 | 282.1 | 273.7 | 342.7 | 315.0 | 367.9 | 401.3 | 437.8 | 477.5 | 520.9 |
| EBITDA, % | 17.13 | 17.39 | 16.85 | 17.97 | 15.93 | 17.05 | 17.05 | 17.05 | 17.05 | 17.05 |
| Depreciation | 73.3 | 82.5 | 92.5 | 101.1 | 113.0 | 116.5 | 127.1 | 138.6 | 151.2 | 164.9 |
| Depreciation, % | 5.2 | 5.09 | 5.69 | 5.3 | 5.71 | 5.4 | 5.4 | 5.4 | 5.4 | 5.4 |
| EBIT | 168.0 | 199.6 | 181.2 | 241.6 | 202.0 | 251.4 | 274.2 | 299.2 | 326.3 | 356.0 |
| EBIT, % | 11.93 | 12.31 | 11.15 | 12.67 | 10.21 | 11.65 | 11.65 | 11.65 | 11.65 | 11.65 |
| Total Cash | 502.4 | 372.0 | 320.3 | 155.8 | 597.9 | 503.5 | 549.3 | 599.2 | 653.7 | 713.1 |
| Total Cash, percent | .0 | .0 | .0 | .0 | .0 | .0 | .0 | .0 | .0 | .0 |
| Account Receivables | 678.7 | 676.2 | 770.5 | 1,037.1 | 998.2 | 1,044.6 | 1,139.6 | 1,243.1 | 1,356.1 | 1,479.4 |
| Account Receivables, % | 48.17 | 41.69 | 47.43 | 54.36 | 50.48 | 48.43 | 48.43 | 48.43 | 48.43 | 48.43 |
| Inventories | 258.1 | 375.8 | 400.4 | 415.3 | 486.4 | 485.3 | 529.4 | 577.6 | 630.1 | 687.3 |
| Inventories, % | 18.32 | 23.17 | 24.65 | 21.77 | 24.6 | 22.5 | 22.5 | 22.5 | 22.5 | 22.5 |
| Accounts Payable | 355.4 | 404.0 | 382.8 | 445.3 | 482.3 | 523.9 | 571.5 | 623.4 | 680.1 | 741.9 |
| Accounts Payable, % | 25.22 | 24.91 | 23.57 | 23.34 | 24.39 | 24.29 | 24.29 | 24.29 | 24.29 | 24.29 |
| Capital Expenditure | -144.4 | -219.9 | -242.4 | -306.1 | -316.2 | -305.3 | -333.0 | -363.3 | -396.3 | -432.3 |
| Capital Expenditure, % | -10.25 | -13.56 | -14.92 | -16.05 | -15.99 | -14.15 | -14.15 | -14.15 | -14.15 | -14.15 |
| Tax Rate, % | 12.37 | 12.37 | 12.37 | 12.37 | 12.37 | 12.37 | 12.37 | 12.37 | 12.37 | 12.37 |
| EBITAT | 146.7 | 183.7 | 171.5 | 219.7 | 177.0 | 227.5 | 248.2 | 270.7 | 295.3 | 322.2 |
| Depreciation | ||||||||||
| Changes in Account Receivables | ||||||||||
| Changes in Inventories | ||||||||||
| Changes in Accounts Payable | ||||||||||
| Capital Expenditure | ||||||||||
| UFCF | -505.7 | -20.3 | -118.5 | -204.4 | -21.4 | 34.9 | -49.2 | -53.7 | -58.6 | -63.9 |
| WACC, % | 10.37 | 10.38 | 10.39 | 10.38 | 10.37 | 10.38 | 10.38 | 10.38 | 10.38 | 10.38 |
| PV UFCF | ||||||||||
| SUM PV UFCF | -127.2 | |||||||||
| Long Term Growth Rate, % | 3.50 | |||||||||
| Free cash flow (T + 1) | -66 | |||||||||
| Terminal Value | -962 | |||||||||
| Present Terminal Value | -587 | |||||||||
| Enterprise Value | -714 | |||||||||
| Net Debt | 326 | |||||||||
| Equity Value | -1,040 | |||||||||
| Diluted Shares Outstanding, MM | 294 | |||||||||
| Equity Value Per Share | -3.54 |
What You Will Receive
- Comprehensive Hunan Oil Data: Preloaded financial details – from revenue to EBIT – based on actual and projected figures for Hunan Oil Pump Co., Ltd. (603319SS).
- Fully Customizable: Modify all essential parameters (highlighted cells) such as WACC, growth %, and tax rates to fit your analysis.
- Real-Time Valuation Adjustments: Automatic recalculations to assess how changes affect the fair value of Hunan Oil Pump Co., Ltd. (603319SS).
- User-Friendly Excel Template: Designed for quick modifications, scenario testing, and thorough projections.
- Efficient and Precise: Eliminate the need to build models from scratch while ensuring accuracy and flexibility.
Key Features
- Customizable Forecast Inputs: Adjust essential parameters such as production volume, operating margin, and maintenance costs.
- Instant DCF Valuation: Quickly computes intrinsic value, net present value (NPV), and additional metrics.
- High-Precision Accuracy: Leverages Hunan Oil Pump Co., Ltd.'s (603319SS) actual financial data for dependable valuation results.
- Smooth Scenario Analysis: Easily explore various assumptions and evaluate their impact on outcomes.
- Efficiency Booster: Avoid the complexities of creating intricate valuation models from the ground up.
How It Works
- Step 1: Download the pre-designed Excel template featuring data for Hunan Oil Pump Co., Ltd. (603319SS).
- Step 2: Review the pre-populated sheets to familiarize yourself with the essential metrics.
- Step 3: Modify your forecasts and assumptions in the editable yellow cells (WACC, growth rates, profit margins).
- Step 4: See the updated results instantly, including the intrinsic value of Hunan Oil Pump Co., Ltd. (603319SS).
- Step 5: Utilize the outputs to make well-informed investment choices or create comprehensive reports.
Why Choose Hunan Oil Pump Co., Ltd. (603319SS) Calculator?
- Precise Information: Utilize authentic Hunan Oil Pump financials for dependable valuation outcomes.
- Tailored Options: Modify essential parameters such as growth rates, WACC, and tax rates to align with your forecasts.
- Efficiency: Built-in calculations save you the hassle of starting from the ground up.
- Professional Standard: Crafted for investors, analysts, and consultants in the oil and gas sector.
- Easy to Use: Simple interface and clear, step-by-step guidance cater to all users.
Who Can Benefit from Hunan Oil Pump Co., Ltd. (603319SS)?
- Investors: Gain insights and make informed decisions with our advanced valuation tools.
- Financial Analysts: Streamline your analysis with our customizable DCF model designed for efficiency.
- Consultants: Easily modify the template for compelling client presentations and reports.
- Finance Enthusiasts: Expand your knowledge of valuation methodologies with practical, real-world applications.
- Educators and Students: Utilize our tools as an effective resource in finance and business courses.
Contents of the Template
- Operating and Balance Sheet Data: Pre-filled historical data and forecasts for Hunan Oil Pump Co., Ltd. (603319SS), encompassing revenue, EBITDA, EBIT, and capital expenditures.
- WACC Calculation: A specialized sheet for calculating the Weighted Average Cost of Capital (WACC), featuring metrics such as Beta, risk-free rate, and share price.
- DCF Valuation (Unlevered and Levered): Customizable Discounted Cash Flow models that detail intrinsic value with comprehensive calculations.
- Financial Statements: Pre-loaded annual and quarterly financial statements to facilitate in-depth analysis.
- Key Ratios: Includes essential profitability, leverage, and efficiency ratios specific to Hunan Oil Pump Co., Ltd. (603319SS).
- Dashboard and Charts: A visual overview of valuation outputs and underlying assumptions for streamlined analysis of results.
Disclaimer
All information, articles, and product details provided on this website are for general informational and educational purposes only. We do not claim any ownership over, nor do we intend to infringe upon, any trademarks, copyrights, logos, brand names, or other intellectual property mentioned or depicted on this site. Such intellectual property remains the property of its respective owners, and any references here are made solely for identification or informational purposes, without implying any affiliation, endorsement, or partnership.
We make no representations or warranties, express or implied, regarding the accuracy, completeness, or suitability of any content or products presented. Nothing on this website should be construed as legal, tax, investment, financial, medical, or other professional advice. In addition, no part of this site—including articles or product references—constitutes a solicitation, recommendation, endorsement, advertisement, or offer to buy or sell any securities, franchises, or other financial instruments, particularly in jurisdictions where such activity would be unlawful.
All content is of a general nature and may not address the specific circumstances of any individual or entity. It is not a substitute for professional advice or services. Any actions you take based on the information provided here are strictly at your own risk. You accept full responsibility for any decisions or outcomes arising from your use of this website and agree to release us from any liability in connection with your use of, or reliance upon, the content or products found herein.