
|
Beijing Wantai Biological Pharmacy Enterprise Co., Ltd. (603392.SS) Évaluation DCF |
Entièrement Modifiable: Adapté À Vos Besoins Dans Excel Ou Sheets
Conception Professionnelle: Modèles Fiables Et Conformes Aux Normes Du Secteur
Pré-Construits Pour Une Utilisation Rapide Et Efficace
Compatible MAC/PC, entièrement débloqué
Aucune Expertise N'Est Requise; Facile À Suivre
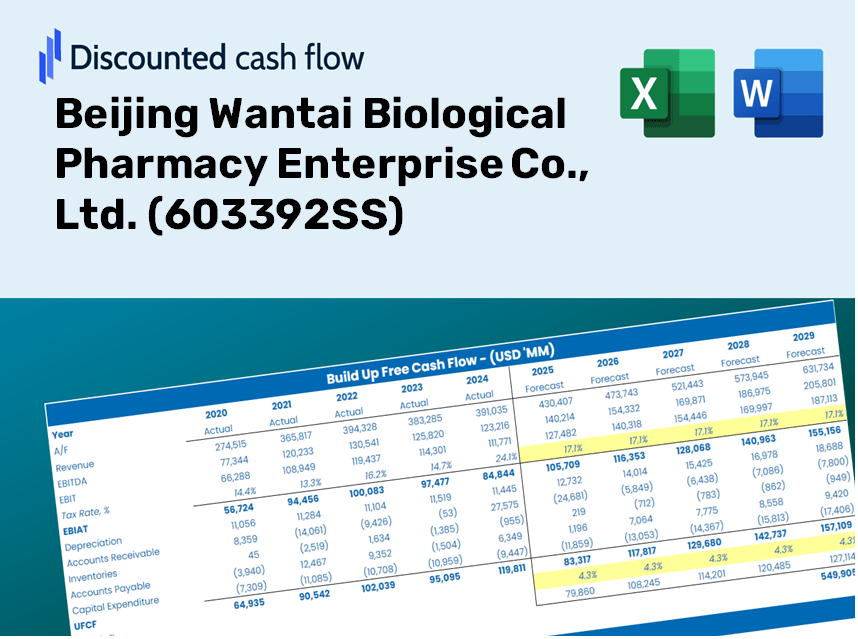
Beijing Wantai Biological Pharmacy Enterprise Co., Ltd. (603392.SS) Bundle
Que vous soyez un investisseur ou un analyste, cette calculatrice DCF (603392SS) est votre outil de référence pour une évaluation précise. Équipé de données réelles de Beijing Wantai Biological Pharmacy Enterprise Co., Ltd., vous pouvez ajuster les prévisions et observer instantanément les effets.
Discounted Cash Flow (DCF) - (USD MM)
| Year | AY1 2020 |
AY2 2021 |
AY3 2022 |
AY4 2023 |
AY5 2024 |
FY1 2025 |
FY2 2026 |
FY3 2027 |
FY4 2028 |
FY5 2029 |
|---|---|---|---|---|---|---|---|---|---|---|
| Revenue | 2,354.3 | 5,750.3 | 11,185.2 | 5,510.8 | 2,245.4 | 2,719.9 | 3,294.7 | 3,990.9 | 4,834.3 | 5,855.8 |
| Revenue Growth, % | 0 | 144.25 | 94.51 | -50.73 | -59.25 | 21.13 | 21.13 | 21.13 | 21.13 | 21.13 |
| EBITDA | 809.2 | 2,333.8 | 5,400.7 | 1,579.4 | -65.1 | 810.6 | 981.8 | 1,189.3 | 1,440.7 | 1,745.1 |
| EBITDA, % | 34.37 | 40.59 | 48.28 | 28.66 | -2.9 | 29.8 | 29.8 | 29.8 | 29.8 | 29.8 |
| Depreciation | 84.5 | 96.2 | 136.2 | 215.3 | 250.3 | 117.1 | 141.9 | 171.9 | 208.2 | 252.2 |
| Depreciation, % | 3.59 | 1.67 | 1.22 | 3.91 | 11.15 | 4.31 | 4.31 | 4.31 | 4.31 | 4.31 |
| EBIT | 724.7 | 2,237.6 | 5,264.6 | 1,364.1 | -315.4 | 693.4 | 840.0 | 1,017.5 | 1,232.5 | 1,492.9 |
| EBIT, % | 30.78 | 38.91 | 47.07 | 24.75 | -14.05 | 25.49 | 25.49 | 25.49 | 25.49 | 25.49 |
| Total Cash | 761.0 | 1,455.7 | 7,200.9 | 6,273.7 | 4,897.9 | 1,751.7 | 2,121.9 | 2,570.3 | 3,113.5 | 3,771.4 |
| Total Cash, percent | .0 | .0 | .0 | .0 | .0 | .0 | .0 | .0 | .0 | .0 |
| Account Receivables | 728.1 | 2,285.5 | 3,970.7 | 2,999.0 | 2,077.2 | 1,376.8 | 1,667.8 | 2,020.2 | 2,447.1 | 2,964.2 |
| Account Receivables, % | 30.93 | 39.75 | 35.5 | 54.42 | 92.51 | 50.62 | 50.62 | 50.62 | 50.62 | 50.62 |
| Inventories | 400.0 | 593.2 | 869.1 | 905.5 | 863.2 | 489.3 | 592.7 | 718.0 | 869.7 | 1,053.5 |
| Inventories, % | 16.99 | 10.32 | 7.77 | 16.43 | 38.44 | 17.99 | 17.99 | 17.99 | 17.99 | 17.99 |
| Accounts Payable | 112.7 | 193.5 | 317.0 | 299.9 | 444.9 | 197.1 | 238.8 | 289.3 | 350.4 | 424.4 |
| Accounts Payable, % | 4.79 | 3.36 | 2.83 | 5.44 | 19.81 | 7.25 | 7.25 | 7.25 | 7.25 | 7.25 |
| Capital Expenditure | -390.4 | -1,047.8 | -929.9 | -1,159.7 | -887.3 | -564.0 | -683.2 | -827.6 | -1,002.4 | -1,214.3 |
| Capital Expenditure, % | -16.58 | -18.22 | -8.31 | -21.04 | -39.52 | -20.74 | -20.74 | -20.74 | -20.74 | -20.74 |
| Tax Rate, % | -57.43 | -57.43 | -57.43 | -57.43 | -57.43 | -57.43 | -57.43 | -57.43 | -57.43 | -57.43 |
| EBITAT | 641.8 | 1,946.2 | 4,465.9 | 1,221.5 | -496.5 | 624.0 | 755.8 | 915.5 | 1,109.0 | 1,343.4 |
| Depreciation | ||||||||||
| Changes in Account Receivables | ||||||||||
| Changes in Inventories | ||||||||||
| Changes in Accounts Payable | ||||||||||
| Capital Expenditure | ||||||||||
| UFCF | -679.5 | -675.2 | 1,834.6 | 1,195.3 | -24.5 | 1,003.6 | -138.2 | -167.4 | -202.8 | -245.6 |
| WACC, % | 10.13 | 10.13 | 10.13 | 10.13 | 10.13 | 10.13 | 10.13 | 10.13 | 10.13 | 10.13 |
| PV UFCF | ||||||||||
| SUM PV UFCF | 382.6 | |||||||||
| Long Term Growth Rate, % | 3.00 | |||||||||
| Free cash flow (T + 1) | -253 | |||||||||
| Terminal Value | -3,546 | |||||||||
| Present Terminal Value | -2,189 | |||||||||
| Enterprise Value | -1,806 | |||||||||
| Net Debt | -2,109 | |||||||||
| Equity Value | 303 | |||||||||
| Diluted Shares Outstanding, MM | 1,328 | |||||||||
| Equity Value Per Share | 0.23 |
What You Will Receive
- Authentic Beijing Wantai Data: Comprehensive financials – from revenue to EBIT – derived from both actual and projected figures.
- Complete Customization: Modify all essential parameters (highlighted cells) such as WACC, growth percentage, and tax rates.
- Immediate Valuation Adjustments: Automatic recalculations to assess the impact of changes on the fair value of Beijing Wantai (603392SS).
- Flexible Excel Template: Designed for easy modifications, scenario analyses, and in-depth projections.
- Efficient and Precise: Avoid building models from the ground up while ensuring accuracy and adaptability.
Key Features
- Comprehensive Financial Data: Access reliable historical figures and forward-looking projections for Beijing Wantai Biological Pharmacy Enterprise Co., Ltd. (603392SS).
- Tailored Forecast Inputs: Modify highlighted fields such as WACC, growth rates, and profit margins to suit your analysis.
- Real-Time Calculations: Enjoy automatic updates for DCF, Net Present Value (NPV), and cash flow assessments.
- User-Friendly Dashboard: Utilize easy-to-understand charts and summaries for a clear visual representation of your valuation findings.
- Designed for All Skill Levels: A straightforward and intuitive layout tailored for investors, CFOs, and consultants alike.
How It Functions
- Download the Template: Gain immediate access to the Excel-based Wantai DCF Calculator for Beijing Wantai Biological Pharmacy Enterprise Co., Ltd. (603392SS).
- Input Your Assumptions: Modify the yellow-highlighted cells for growth rates, WACC, profit margins, and additional parameters.
- Instant Calculations: The model automatically recalculates the intrinsic value of Beijing Wantai Biological Pharmacy Enterprise Co., Ltd. (603392SS).
- Test Scenarios: Experiment with various assumptions to assess potential changes in valuation.
- Analyze and Decide: Utilize the outcomes to inform your investment strategy or financial evaluation.
Why Opt for This Calculator?
- User-Friendly: Tailored for both novices and seasoned professionals.
- Customizable Inputs: Adjust variables easily to suit your analytical needs.
- Real-Time Updates: Monitor immediate changes to Beijing Wantai Biological Pharmacy’s valuation as you modify inputs.
- Pre-Configured: Comes with Beijing Wantai’s up-to-date financial data for swift evaluation.
- Relied Upon by Experts: Favored by investors and analysts for making well-informed choices.
Who Can Benefit from This Product?
- Investors: Evaluate the valuation of Beijing Wantai Biological Pharmacy Enterprise Co., Ltd. (603392SS) before making stock transactions.
- CFOs and Financial Analysts: Enhance valuation methodologies and validate financial forecasts.
- Startup Founders: Understand the valuation strategies of established companies like Beijing Wantai Biological Pharmacy Enterprise Co., Ltd. (603392SS).
- Consultants: Create and present comprehensive valuation reports for clients.
- Students and Educators: Utilize practical data to teach and refine valuation approaches.
Contents of the Template
- Historical Data: Contains past financial performance and foundational forecasts for Beijing Wantai Biological Pharmacy Enterprise Co., Ltd. (603392SS).
- DCF and Levered DCF Models: Comprehensive templates designed to assess the intrinsic value of Beijing Wantai Biological Pharmacy Enterprise Co., Ltd. (603392SS).
- WACC Sheet: Ready-to-use calculations for the Weighted Average Cost of Capital.
- Editable Inputs: Customize essential variables such as growth rates, EBITDA percentages, and CAPEX forecasts.
- Quarterly and Annual Statements: An in-depth analysis of the financial statements for Beijing Wantai Biological Pharmacy Enterprise Co., Ltd. (603392SS).
- Interactive Dashboard: Dynamically visualize valuation outcomes and future projections.
Disclaimer
All information, articles, and product details provided on this website are for general informational and educational purposes only. We do not claim any ownership over, nor do we intend to infringe upon, any trademarks, copyrights, logos, brand names, or other intellectual property mentioned or depicted on this site. Such intellectual property remains the property of its respective owners, and any references here are made solely for identification or informational purposes, without implying any affiliation, endorsement, or partnership.
We make no representations or warranties, express or implied, regarding the accuracy, completeness, or suitability of any content or products presented. Nothing on this website should be construed as legal, tax, investment, financial, medical, or other professional advice. In addition, no part of this site—including articles or product references—constitutes a solicitation, recommendation, endorsement, advertisement, or offer to buy or sell any securities, franchises, or other financial instruments, particularly in jurisdictions where such activity would be unlawful.
All content is of a general nature and may not address the specific circumstances of any individual or entity. It is not a substitute for professional advice or services. Any actions you take based on the information provided here are strictly at your own risk. You accept full responsibility for any decisions or outcomes arising from your use of this website and agree to release us from any liability in connection with your use of, or reliance upon, the content or products found herein.