
|
Guizhou Sanli Pharmaceutical Co., Ltd (603439.SS) Évaluation DCF |
Entièrement Modifiable: Adapté À Vos Besoins Dans Excel Ou Sheets
Conception Professionnelle: Modèles Fiables Et Conformes Aux Normes Du Secteur
Pré-Construits Pour Une Utilisation Rapide Et Efficace
Compatible MAC/PC, entièrement débloqué
Aucune Expertise N'Est Requise; Facile À Suivre
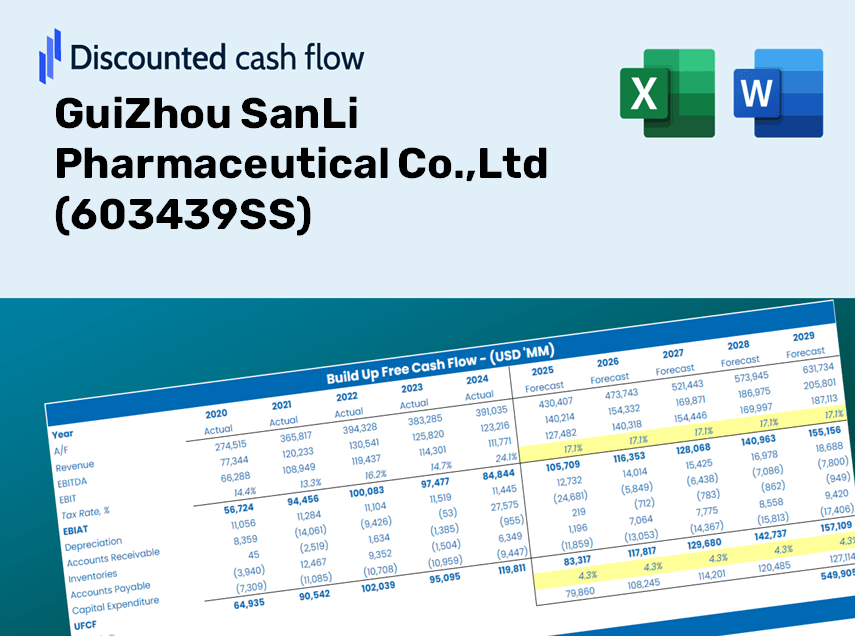
GuiZhou SanLi Pharmaceutical Co.,Ltd (603439.SS) Bundle
Simplifiez Guizhou Sanli Pharmaceutical Co., Ltd Valation avec cette calculatrice DCF personnalisable! Doté de Real Guizhou Sanli Pharmaceutical Co., Ltd Financials et des intrants de prévision réglables, vous pouvez tester des scénarios et découvrir Guizhou Sanli Pharmaceutical Co., Ltd Fair Value en minutes.
Discounted Cash Flow (DCF) - (USD MM)
| Year | AY1 2020 |
AY2 2021 |
AY3 2022 |
AY4 2023 |
AY5 2024 |
FY1 2025 |
FY2 2026 |
FY3 2027 |
FY4 2028 |
FY5 2029 |
|---|---|---|---|---|---|---|---|---|---|---|
| Revenue | 630.2 | 939.0 | 1,201.3 | 1,635.0 | 2,144.4 | 2,917.4 | 3,969.0 | 5,399.6 | 7,346.0 | 9,993.9 |
| Revenue Growth, % | 0 | 48.99 | 27.94 | 36.1 | 31.16 | 36.05 | 36.05 | 36.05 | 36.05 | 36.05 |
| EBITDA | 113.0 | 191.6 | 244.0 | 369.2 | 415.4 | 586.9 | 798.5 | 1,086.3 | 1,477.9 | 2,010.6 |
| EBITDA, % | 17.93 | 20.4 | 20.31 | 22.58 | 19.37 | 20.12 | 20.12 | 20.12 | 20.12 | 20.12 |
| Depreciation | 8.1 | 11.2 | 17.8 | 37.6 | 75.7 | 57.2 | 77.8 | 105.8 | 144.0 | 195.8 |
| Depreciation, % | 1.29 | 1.19 | 1.49 | 2.3 | 3.53 | 1.96 | 1.96 | 1.96 | 1.96 | 1.96 |
| EBIT | 104.9 | 180.4 | 226.1 | 331.6 | 339.7 | 529.8 | 720.7 | 980.5 | 1,334.0 | 1,814.8 |
| EBIT, % | 16.64 | 19.21 | 18.82 | 20.28 | 15.84 | 18.16 | 18.16 | 18.16 | 18.16 | 18.16 |
| Total Cash | 450.1 | 642.2 | 630.8 | 622.9 | 497.8 | 1,479.8 | 2,013.3 | 2,739.0 | 3,726.3 | 5,069.4 |
| Total Cash, percent | .0 | .0 | .0 | .0 | .0 | .0 | .0 | .0 | .0 | .0 |
| Account Receivables | 288.8 | 364.6 | 432.8 | 686.2 | 939.2 | 1,204.6 | 1,638.8 | 2,229.5 | 3,033.1 | 4,126.5 |
| Account Receivables, % | 45.82 | 38.83 | 36.03 | 41.97 | 43.8 | 41.29 | 41.29 | 41.29 | 41.29 | 41.29 |
| Inventories | 47.5 | 88.6 | 98.1 | 175.7 | 320.7 | 296.6 | 403.6 | 549.0 | 746.9 | 1,016.2 |
| Inventories, % | 7.54 | 9.43 | 8.16 | 10.75 | 14.96 | 10.17 | 10.17 | 10.17 | 10.17 | 10.17 |
| Accounts Payable | 36.1 | 99.5 | 178.4 | 294.7 | 360.6 | 385.2 | 524.0 | 712.9 | 969.8 | 1,319.4 |
| Accounts Payable, % | 5.73 | 10.59 | 14.85 | 18.02 | 16.82 | 13.2 | 13.2 | 13.2 | 13.2 | 13.2 |
| Capital Expenditure | -51.7 | -26.1 | -119.9 | -108.7 | -45.2 | -173.4 | -235.9 | -321.0 | -436.7 | -594.1 |
| Capital Expenditure, % | -8.2 | -2.78 | -9.98 | -6.65 | -2.11 | -5.94 | -5.94 | -5.94 | -5.94 | -5.94 |
| Tax Rate, % | 15.69 | 15.69 | 15.69 | 15.69 | 15.69 | 15.69 | 15.69 | 15.69 | 15.69 | 15.69 |
| EBITAT | 89.7 | 155.5 | 204.5 | 290.6 | 286.4 | 459.9 | 625.7 | 851.2 | 1,158.1 | 1,575.5 |
| Depreciation | ||||||||||
| Changes in Account Receivables | ||||||||||
| Changes in Inventories | ||||||||||
| Changes in Accounts Payable | ||||||||||
| Capital Expenditure | ||||||||||
| UFCF | -254.1 | 87.1 | 103.7 | 4.8 | -15.2 | 126.9 | 65.3 | 88.8 | 120.8 | 164.3 |
| WACC, % | 6.46 | 6.46 | 6.48 | 6.47 | 6.45 | 6.46 | 6.46 | 6.46 | 6.46 | 6.46 |
| PV UFCF | ||||||||||
| SUM PV UFCF | 464.5 | |||||||||
| Long Term Growth Rate, % | 3.50 | |||||||||
| Free cash flow (T + 1) | 170 | |||||||||
| Terminal Value | 5,741 | |||||||||
| Present Terminal Value | 4,198 | |||||||||
| Enterprise Value | 4,662 | |||||||||
| Net Debt | 86 | |||||||||
| Equity Value | 4,576 | |||||||||
| Diluted Shares Outstanding, MM | 409 | |||||||||
| Equity Value Per Share | 11.19 |
What You Will Receive
- Adjustable Forecast Parameters: Easily modify assumptions (growth %, profit margins, WACC) to create various scenarios.
- Relevant Financial Data: GuiZhou SanLi Pharmaceutical Co., Ltd's financial information pre-loaded to enhance your analysis.
- Automated DCF Calculations: The template computes Net Present Value (NPV) and intrinsic value for you effortlessly.
- Customizable and Professional Design: A sleek Excel model that can be tailored to your valuation requirements.
- Designed for Analysts and Investors: Perfect for evaluating projections, testing strategies, and optimizing your time.
Key Features
- Customizable Forecast Inputs: Easily adjust essential factors such as revenue growth, EBITDA margin, and capital investments.
- Instant DCF Valuation: Automatically computes intrinsic value, NPV, and additional metrics in real-time.
- High Precision Accuracy: Leverages GuiZhou SanLi Pharmaceutical Co., Ltd's actual financial data for credible valuation results.
- Simplified Scenario Analysis: Effortlessly evaluate various assumptions and analyze different outcomes.
- Efficiency Booster: Remove the hassle of constructing intricate valuation models from the ground up.
How It Functions
- Step 1: Download the Excel file.
- Step 2: Review the pre-filled data for GuiZhou SanLi Pharmaceutical Co., Ltd (603439SS), including historical and projected figures.
- Step 3: Modify the key assumptions (highlighted in yellow) according to your analysis.
- Step 4: Observe the automatic recalculations of GuiZhou SanLi Pharmaceutical's intrinsic value.
- Step 5: Utilize the results for making investment decisions or preparing reports.
Why Opt for Our Financial Calculator?
- All-in-One Solution: Features DCF, WACC, and financial ratio analyses, tailored for GuiZhou SanLi Pharmaceutical Co.,Ltd (603439SS).
- Flexible Parameters: Modify the highlighted cells to explore different financial scenarios.
- In-Depth Analysis: Automatically computes the intrinsic value and Net Present Value for GuiZhou SanLi Pharmaceutical Co.,Ltd (603439SS).
- Preloaded Insights: Access historical and forecasted data for a reliable foundation.
- High-Quality Standards: Perfect for financial analysts, investors, and consultants focused on GuiZhou SanLi Pharmaceutical Co.,Ltd (603439SS).
Who Should Utilize This Product?
- Professional Investors: Create comprehensive and dependable valuation models for assessing portfolios related to GuiZhou SanLi Pharmaceutical Co., Ltd (603439SS).
- Corporate Finance Teams: Evaluate valuation scenarios to inform strategic decisions within the organization.
- Consultants and Advisors: Deliver precise valuation insights to clients regarding GuiZhou SanLi Pharmaceutical Co., Ltd (603439SS).
- Students and Educators: Leverage real-world data to enhance financial modeling practices and curriculum.
- Pharmaceutical Enthusiasts: Gain an understanding of how companies like GuiZhou SanLi Pharmaceutical Co., Ltd (603439SS) are valued in the market.
Contents of the Template
- Pre-Filled Data: Contains GuiZhou SanLi Pharmaceutical's historical financials and projections.
- Discounted Cash Flow Model: A customizable DCF valuation model with automated computations.
- Weighted Average Cost of Capital (WACC): A specific sheet designed for WACC calculation using tailored inputs.
- Key Financial Ratios: Assess GuiZhou SanLi Pharmaceutical's profitability, efficiency, and leverage metrics.
- Customizable Inputs: Easily modify revenue growth rates, profit margins, and tax parameters.
- Intuitive Dashboard: Visualizations and tables highlighting essential valuation outcomes.
Disclaimer
All information, articles, and product details provided on this website are for general informational and educational purposes only. We do not claim any ownership over, nor do we intend to infringe upon, any trademarks, copyrights, logos, brand names, or other intellectual property mentioned or depicted on this site. Such intellectual property remains the property of its respective owners, and any references here are made solely for identification or informational purposes, without implying any affiliation, endorsement, or partnership.
We make no representations or warranties, express or implied, regarding the accuracy, completeness, or suitability of any content or products presented. Nothing on this website should be construed as legal, tax, investment, financial, medical, or other professional advice. In addition, no part of this site—including articles or product references—constitutes a solicitation, recommendation, endorsement, advertisement, or offer to buy or sell any securities, franchises, or other financial instruments, particularly in jurisdictions where such activity would be unlawful.
All content is of a general nature and may not address the specific circumstances of any individual or entity. It is not a substitute for professional advice or services. Any actions you take based on the information provided here are strictly at your own risk. You accept full responsibility for any decisions or outcomes arising from your use of this website and agree to release us from any liability in connection with your use of, or reliance upon, the content or products found herein.