
|
AIMA Technology Group CO., Ltd (603529.SS) Évaluation DCF |
Entièrement Modifiable: Adapté À Vos Besoins Dans Excel Ou Sheets
Conception Professionnelle: Modèles Fiables Et Conformes Aux Normes Du Secteur
Pré-Construits Pour Une Utilisation Rapide Et Efficace
Compatible MAC/PC, entièrement débloqué
Aucune Expertise N'Est Requise; Facile À Suivre
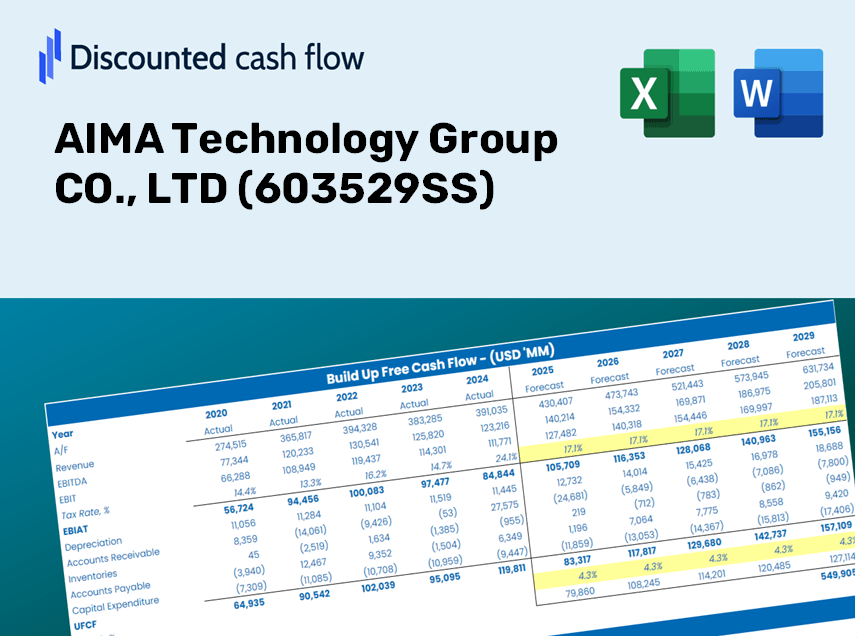
AIMA Technology Group CO., LTD (603529.SS) Bundle
Évaluez les perspectives financières d'Aima Technology Group CO., Ltd comme un expert! Cette calculatrice DCF (603529SS) vous fournit des données financières pré-remplies et une flexibilité complète pour modifier la croissance des revenus, le WACC, les marges et autres hypothèses critiques pour s'aligner sur vos prévisions.
Discounted Cash Flow (DCF) - (USD MM)
| Year | AY1 2020 |
AY2 2021 |
AY3 2022 |
AY4 2023 |
AY5 2024 |
FY1 2025 |
FY2 2026 |
FY3 2027 |
FY4 2028 |
FY5 2029 |
|---|---|---|---|---|---|---|---|---|---|---|
| Revenue | 12,904.6 | 15,398.7 | 20,802.2 | 21,036.1 | 21,606.3 | 22,109.6 | 22,624.5 | 23,151.5 | 23,690.8 | 24,242.6 |
| Revenue Growth, % | 0 | 19.33 | 35.09 | 1.12 | 2.71 | 2.33 | 2.33 | 2.33 | 2.33 | 2.33 |
| EBITDA | 694.8 | 697.6 | 2,024.4 | 2,035.4 | 2,222.6 | 1,751.5 | 1,792.3 | 1,834.0 | 1,876.7 | 1,920.4 |
| EBITDA, % | 5.38 | 4.53 | 9.73 | 9.68 | 10.29 | 7.92 | 7.92 | 7.92 | 7.92 | 7.92 |
| Depreciation | 182.7 | 218.6 | 259.8 | 355.8 | 417.7 | 340.9 | 348.8 | 356.9 | 365.3 | 373.8 |
| Depreciation, % | 1.42 | 1.42 | 1.25 | 1.69 | 1.93 | 1.54 | 1.54 | 1.54 | 1.54 | 1.54 |
| EBIT | 512.2 | 478.9 | 1,764.7 | 1,679.6 | 1,804.9 | 1,410.6 | 1,443.4 | 1,477.1 | 1,511.5 | 1,546.7 |
| EBIT, % | 3.97 | 3.11 | 8.48 | 7.98 | 8.35 | 6.38 | 6.38 | 6.38 | 6.38 | 6.38 |
| Total Cash | 1,707.6 | 4,112.1 | 6,776.1 | 6,843.3 | 6,584.3 | 5,992.4 | 6,132.0 | 6,274.8 | 6,420.9 | 6,570.5 |
| Total Cash, percent | .0 | .0 | .0 | .0 | .0 | .0 | .0 | .0 | .0 | .0 |
| Account Receivables | 532.9 | 407.0 | 326.8 | 366.7 | 437.3 | 535.5 | 548.0 | 560.7 | 573.8 | 587.2 |
| Account Receivables, % | 4.13 | 2.64 | 1.57 | 1.74 | 2.02 | 2.42 | 2.42 | 2.42 | 2.42 | 2.42 |
| Inventories | 494.8 | 795.7 | 810.5 | 575.3 | 810.7 | 857.2 | 877.1 | 897.6 | 918.5 | 939.9 |
| Inventories, % | 3.83 | 5.17 | 3.9 | 2.74 | 3.75 | 3.88 | 3.88 | 3.88 | 3.88 | 3.88 |
| Accounts Payable | 5,937.3 | 7,058.5 | 9,389.2 | 8,491.5 | 9,365.5 | 9,758.9 | 9,986.2 | 10,218.8 | 10,456.9 | 10,700.4 |
| Accounts Payable, % | 46.01 | 45.84 | 45.14 | 40.37 | 43.35 | 44.14 | 44.14 | 44.14 | 44.14 | 44.14 |
| Capital Expenditure | -363.5 | -659.6 | -842.3 | -1,960.2 | -3,394.6 | -1,599.8 | -1,637.1 | -1,675.2 | -1,714.2 | -1,754.1 |
| Capital Expenditure, % | -2.82 | -4.28 | -4.05 | -9.32 | -15.71 | -7.24 | -7.24 | -7.24 | -7.24 | -7.24 |
| Tax Rate, % | 14.77 | 14.77 | 14.77 | 14.77 | 14.77 | 14.77 | 14.77 | 14.77 | 14.77 | 14.77 |
| EBITAT | 393.5 | 419.4 | 1,484.5 | 1,427.5 | 1,538.2 | 1,181.3 | 1,208.8 | 1,237.0 | 1,265.8 | 1,295.3 |
| Depreciation | ||||||||||
| Changes in Account Receivables | ||||||||||
| Changes in Inventories | ||||||||||
| Changes in Accounts Payable | ||||||||||
| Capital Expenditure | ||||||||||
| UFCF | 5,122.3 | 924.6 | 3,298.1 | -879.4 | -870.6 | 171.2 | 115.5 | 118.2 | 120.9 | 123.7 |
| WACC, % | 4.57 | 4.6 | 4.59 | 4.59 | 4.59 | 4.59 | 4.59 | 4.59 | 4.59 | 4.59 |
| PV UFCF | ||||||||||
| SUM PV UFCF | 572.4 | |||||||||
| Long Term Growth Rate, % | 3.00 | |||||||||
| Free cash flow (T + 1) | 127 | |||||||||
| Terminal Value | 8,023 | |||||||||
| Present Terminal Value | 6,410 | |||||||||
| Enterprise Value | 6,983 | |||||||||
| Net Debt | -1,076 | |||||||||
| Equity Value | 8,059 | |||||||||
| Diluted Shares Outstanding, MM | 880 | |||||||||
| Equity Value Per Share | 9.16 |
Benefits of Choosing AIMA Technology Group (603529SS)
- Flexible Forecast Inputs: Adjust key assumptions (growth %, margins, WACC) effortlessly to explore various scenarios.
- Industry-Specific Data: AIMA’s financial metrics pre-loaded to kickstart your analytical process.
- Instant DCF Calculations: The template automatically computes Net Present Value (NPV) and intrinsic value.
- Customizable and Professional Design: An elegant Excel model tailored to meet your valuation requirements.
- Designed for Analysts and Investors: Perfect for evaluating forecasts, verifying strategies, and enhancing efficiency.
Key Features
- Authentic Financial Data: Gain access to precise pre-loaded historical figures and future forecasts for AIMA Technology Group CO., LTD (603529SS).
- Adjustable Forecast Parameters: Modify the highlighted cells for WACC, growth rates, and profit margins.
- Real-Time Calculations: Enjoy automatic updates for DCF, Net Present Value (NPV), and cash flow assessments.
- User-Friendly Dashboard: View easy-to-understand charts and summaries to better interpret your valuation outcomes.
- Designed for All Skill Levels: A straightforward and intuitive layout tailored for investors, CFOs, and consultants alike.
How It Operates
- 1. Access the Template: Download and open the Excel file containing AIMA Technology Group CO., LTD’s preloaded data.
- 2. Adjust Assumptions: Modify key parameters such as growth rates, WACC, and capital expenditures as needed.
- 3. View Results in Real-Time: The DCF model automatically calculates intrinsic value and NPV based on your inputs.
- 4. Analyze Scenarios: Evaluate various forecasts to explore different valuation possibilities.
- 5. Present with Assurance: Deliver expert valuation insights to back your decision-making for AIMA Technology Group CO., LTD (603529SS).
Why Choose AIMA Technology Group CO., LTD (603529SS)?
- Precision: Leverage real AIMA financial data for reliable insights.
- Versatility: Tailored for users to easily modify and experiment with inputs.
- Efficiency: Eliminate the need to create a financial model from the ground up.
- Expert-Driven: Crafted with the expertise and accuracy expected from industry leaders.
- Intuitive Design: Simple to navigate, suitable for users of all financial backgrounds.
Who Can Benefit from AIMA Technology Group CO., LTD (603529SS)?
- Investors: Evaluate AIMA's market valuation prior to making stock purchase or sale decisions.
- CFOs and Financial Analysts: Enhance valuation workflows and assess financial projections.
- Startup Founders: Gain insights into the valuation methods used for leading public firms like AIMA.
- Consultants: Provide expert valuation reports tailored to your clients' needs.
- Students and Educators: Utilize authentic data to practice and instruct on valuation techniques.
Contents of the Template
- Detailed DCF Model: An editable template featuring extensive valuation calculations.
- Market Data: AIMA Technology Group CO., LTD's historical and projected financials are preloaded for your analysis.
- Adjustable Parameters: Modify WACC, growth rates, and tax assumptions to explore various scenarios.
- Financial Statements: Complete annual and quarterly breakdowns providing in-depth insights.
- Key Financial Ratios: Integrated analysis covering profitability, efficiency, and leverage metrics.
- Dashboard with Visual Data: Visualizations and tables designed for clear and actionable outcomes.
Disclaimer
All information, articles, and product details provided on this website are for general informational and educational purposes only. We do not claim any ownership over, nor do we intend to infringe upon, any trademarks, copyrights, logos, brand names, or other intellectual property mentioned or depicted on this site. Such intellectual property remains the property of its respective owners, and any references here are made solely for identification or informational purposes, without implying any affiliation, endorsement, or partnership.
We make no representations or warranties, express or implied, regarding the accuracy, completeness, or suitability of any content or products presented. Nothing on this website should be construed as legal, tax, investment, financial, medical, or other professional advice. In addition, no part of this site—including articles or product references—constitutes a solicitation, recommendation, endorsement, advertisement, or offer to buy or sell any securities, franchises, or other financial instruments, particularly in jurisdictions where such activity would be unlawful.
All content is of a general nature and may not address the specific circumstances of any individual or entity. It is not a substitute for professional advice or services. Any actions you take based on the information provided here are strictly at your own risk. You accept full responsibility for any decisions or outcomes arising from your use of this website and agree to release us from any liability in connection with your use of, or reliance upon, the content or products found herein.