
|
Shanghai Zhonggu Logistics Co., Ltd. (603565.SS) Évaluation DCF |
Entièrement Modifiable: Adapté À Vos Besoins Dans Excel Ou Sheets
Conception Professionnelle: Modèles Fiables Et Conformes Aux Normes Du Secteur
Pré-Construits Pour Une Utilisation Rapide Et Efficace
Compatible MAC/PC, entièrement débloqué
Aucune Expertise N'Est Requise; Facile À Suivre
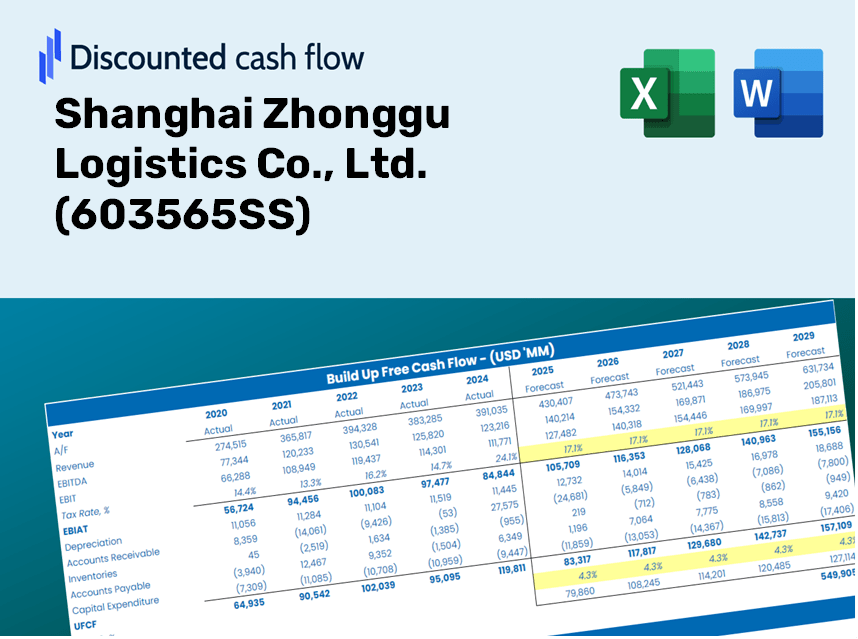
Shanghai Zhonggu Logistics Co., Ltd. (603565.SS) Bundle
Optimisez votre temps et améliorez la précision avec notre calculatrice DCF (603565SS)! Avec des données réelles de Shanghai Zhonggu Logistics Co., Ltd. et des hypothèses personnalisables, cet outil vous permet de prévoir, analyser et évaluer (603565SS) comme un investisseur chevronné.
Discounted Cash Flow (DCF) - (USD MM)
| Year | AY1 2020 |
AY2 2021 |
AY3 2022 |
AY4 2023 |
AY5 2024 |
FY1 2025 |
FY2 2026 |
FY3 2027 |
FY4 2028 |
FY5 2029 |
|---|---|---|---|---|---|---|---|---|---|---|
| Revenue | 10,419.2 | 12,291.2 | 14,208.9 | 12,438.8 | 11,258.3 | 12,156.0 | 13,125.3 | 14,171.9 | 15,301.9 | 16,522.1 |
| Revenue Growth, % | 0 | 17.97 | 15.6 | -12.46 | -9.49 | 7.97 | 7.97 | 7.97 | 7.97 | 7.97 |
| EBITDA | 1,614.7 | 2,633.3 | 3,249.6 | 1,912.3 | 1,977.7 | 2,254.5 | 2,434.3 | 2,628.4 | 2,838.0 | 3,064.3 |
| EBITDA, % | 15.5 | 21.42 | 22.87 | 15.37 | 17.57 | 18.55 | 18.55 | 18.55 | 18.55 | 18.55 |
| Depreciation | 348.1 | 283.3 | 341.0 | 452.0 | 559.0 | 404.7 | 436.9 | 471.8 | 509.4 | 550.0 |
| Depreciation, % | 3.34 | 2.31 | 2.4 | 3.63 | 4.97 | 3.33 | 3.33 | 3.33 | 3.33 | 3.33 |
| EBIT | 1,266.6 | 2,349.9 | 2,908.6 | 1,460.3 | 1,418.7 | 1,849.8 | 1,997.3 | 2,156.6 | 2,328.6 | 2,514.2 |
| EBIT, % | 12.16 | 19.12 | 20.47 | 11.74 | 12.6 | 15.22 | 15.22 | 15.22 | 15.22 | 15.22 |
| Total Cash | 4,544.4 | 9,906.1 | 9,310.6 | 10,265.8 | 12,327.3 | 9,050.6 | 9,772.3 | 10,551.5 | 11,392.9 | 12,301.3 |
| Total Cash, percent | .0 | .0 | .0 | .0 | .0 | .0 | .0 | .0 | .0 | .0 |
| Account Receivables | 471.8 | 827.8 | 622.9 | 512.3 | 524.5 | 593.8 | 641.1 | 692.3 | 747.5 | 807.1 |
| Account Receivables, % | 4.53 | 6.73 | 4.38 | 4.12 | 4.66 | 4.88 | 4.88 | 4.88 | 4.88 | 4.88 |
| Inventories | 94.4 | 80.0 | 125.4 | 85.3 | 51.8 | 87.2 | 94.1 | 101.6 | 109.7 | 118.5 |
| Inventories, % | 0.90639 | 0.65069 | 0.88286 | 0.68565 | 0.46045 | 0.71721 | 0.71721 | 0.71721 | 0.71721 | 0.71721 |
| Accounts Payable | 1,752.6 | 2,055.6 | 2,970.5 | 2,985.0 | 2,618.4 | 2,472.7 | 2,669.8 | 2,882.7 | 3,112.6 | 3,360.8 |
| Accounts Payable, % | 16.82 | 16.72 | 20.91 | 24 | 23.26 | 20.34 | 20.34 | 20.34 | 20.34 | 20.34 |
| Capital Expenditure | -787.7 | -811.6 | -2,333.3 | -3,044.3 | -707.5 | -1,491.4 | -1,610.3 | -1,738.7 | -1,877.3 | -2,027.0 |
| Capital Expenditure, % | -7.56 | -6.6 | -16.42 | -24.47 | -6.28 | -12.27 | -12.27 | -12.27 | -12.27 | -12.27 |
| Tax Rate, % | 25.23 | 25.23 | 25.23 | 25.23 | 25.23 | 25.23 | 25.23 | 25.23 | 25.23 | 25.23 |
| EBITAT | 943.7 | 1,756.8 | 2,173.4 | 1,099.0 | 1,060.8 | 1,383.7 | 1,494.1 | 1,613.2 | 1,741.8 | 1,880.7 |
| Depreciation | ||||||||||
| Changes in Account Receivables | ||||||||||
| Changes in Inventories | ||||||||||
| Changes in Accounts Payable | ||||||||||
| Capital Expenditure | ||||||||||
| UFCF | 1,690.4 | 1,190.0 | 1,255.5 | -1,328.0 | 566.9 | 46.6 | 463.6 | 500.5 | 540.5 | 583.5 |
| WACC, % | 6.54 | 6.54 | 6.54 | 6.55 | 6.54 | 6.54 | 6.54 | 6.54 | 6.54 | 6.54 |
| PV UFCF | ||||||||||
| SUM PV UFCF | 1,710.5 | |||||||||
| Long Term Growth Rate, % | 0.50 | |||||||||
| Free cash flow (T + 1) | 586 | |||||||||
| Terminal Value | 9,706 | |||||||||
| Present Terminal Value | 7,070 | |||||||||
| Enterprise Value | 8,780 | |||||||||
| Net Debt | -1,123 | |||||||||
| Equity Value | 9,903 | |||||||||
| Diluted Shares Outstanding, MM | 2,110 | |||||||||
| Equity Value Per Share | 4.69 |
Benefits You Will Receive
- Accurate SZL Financial Data: Offers both historical and projected figures for precise valuation.
- Customizable Parameters: Adjust key inputs like WACC, tax rates, revenue growth, and capital expenditures.
- Instantaneous Calculations: Automatically calculates intrinsic value and NPV in real-time.
- Scenario Exploration: Analyze various scenarios to assess the future prospects of Shanghai Zhonggu Logistics (603565SS).
- User-Friendly Interface: Designed for industry professionals while remaining accessible to newcomers.
Key Features
- Real-Time SZL Data: Pre-filled with Shanghai Zhonggu Logistics’ historical performance metrics and future outlooks.
- Fully Customizable Inputs: Tailor parameters such as revenue growth, profit margins, cost of capital, tax rates, and capital expenditures.
- Dynamic Valuation Model: Automatic recalculations of Net Present Value (NPV) and intrinsic value based on your specified inputs.
- Scenario Analysis: Develop various forecasting scenarios to evaluate differing valuation results.
- User-Friendly Interface: Clean, organized layout designed for both industry experts and novices.
How It Works
- 1. Access the Template: Download and open the Excel file containing Shanghai Zhonggu Logistics Co., Ltd.'s (603565SS) preloaded data.
- 2. Modify Assumptions: Adjust key variables such as growth rates, WACC, and capital expenditures to fit your analysis.
- 3. Analyze Results in Real Time: The DCF model automatically calculates intrinsic value and NPV based on your inputs.
- 4. Explore Different Scenarios: Evaluate various forecasts to assess a range of valuation outcomes.
- 5. Proceed with Assurance: Present well-founded valuation insights to inform your strategic decisions.
Why Choose Shanghai Zhonggu Logistics Co., Ltd. (603565SS)?
- Reliability: Backed by accurate logistics data to ensure trustworthiness.
- Adaptability: Engineered for clients to easily adjust and experiment with services.
- Efficiency: Avoid the complexities of logistics planning from the ground up.
- Expert-Level: Crafted with the insight and precision of industry veterans.
- Intuitive: User-friendly interface suitable for individuals with varying levels of logistics experience.
Who Can Benefit from This Service?
- Logistics Professionals: Optimize supply chain operations with accurate data analysis.
- Corporate Finance Teams: Evaluate cost structures to support strategic decision-making.
- Consultants and Advisors: Deliver precise insights on logistics trends for clients looking to improve efficiency.
- Students and Educators: Explore practical applications of logistics concepts using real industry data.
- Business Analysts: Gain a deeper understanding of the logistics sector and its market dynamics.
Contents of the Template
- Pre-Filled DCF Model: Shanghai Zhonggu Logistics Co., Ltd.'s (603565SS) financial data preloaded for immediate application.
- WACC Calculator: Comprehensive calculations for the Weighted Average Cost of Capital.
- Financial Ratios: Assess the profitability, leverage, and efficiency of Shanghai Zhonggu Logistics Co., Ltd. (603565SS).
- Editable Inputs: Modify assumptions such as growth rates, profit margins, and capital expenditures to suit your analysis.
- Financial Statements: Access annual and quarterly reports for in-depth financial analysis.
- Interactive Dashboard: Effortlessly visualize essential valuation metrics and outcomes.
Disclaimer
All information, articles, and product details provided on this website are for general informational and educational purposes only. We do not claim any ownership over, nor do we intend to infringe upon, any trademarks, copyrights, logos, brand names, or other intellectual property mentioned or depicted on this site. Such intellectual property remains the property of its respective owners, and any references here are made solely for identification or informational purposes, without implying any affiliation, endorsement, or partnership.
We make no representations or warranties, express or implied, regarding the accuracy, completeness, or suitability of any content or products presented. Nothing on this website should be construed as legal, tax, investment, financial, medical, or other professional advice. In addition, no part of this site—including articles or product references—constitutes a solicitation, recommendation, endorsement, advertisement, or offer to buy or sell any securities, franchises, or other financial instruments, particularly in jurisdictions where such activity would be unlawful.
All content is of a general nature and may not address the specific circumstances of any individual or entity. It is not a substitute for professional advice or services. Any actions you take based on the information provided here are strictly at your own risk. You accept full responsibility for any decisions or outcomes arising from your use of this website and agree to release us from any liability in connection with your use of, or reliance upon, the content or products found herein.