
|
Zbom Home Collection Co., Ltd (603801.SS) Évaluation DCF |
Entièrement Modifiable: Adapté À Vos Besoins Dans Excel Ou Sheets
Conception Professionnelle: Modèles Fiables Et Conformes Aux Normes Du Secteur
Pré-Construits Pour Une Utilisation Rapide Et Efficace
Compatible MAC/PC, entièrement débloqué
Aucune Expertise N'Est Requise; Facile À Suivre
Zbom Home Collection Co.,Ltd (603801.SS) Bundle
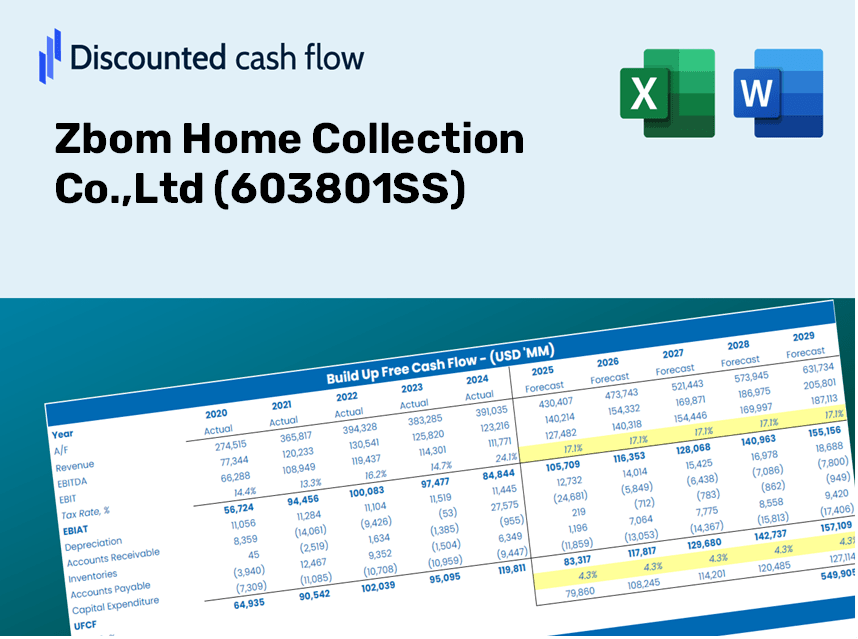
Prenez le contrôle de votre analyse d'évaluation de votre ZBOM Home Collection Co., LTD (603801SS) avec notre calculatrice avancée DCF! Préchargé avec des données réelles (603801SS), ce modèle Excel vous permet d'ajuster les prévisions et les hypothèses pour calculer la valeur intrinsèque de Zbom Home Collection Co., Ltd avec précision.
Discounted Cash Flow (DCF) - (USD MM)
| Year | AY1 2020 |
AY2 2021 |
AY3 2022 |
AY4 2023 |
AY5 2024 |
FY1 2025 |
FY2 2026 |
FY3 2027 |
FY4 2028 |
FY5 2029 |
|---|---|---|---|---|---|---|---|---|---|---|
| Revenue | 3,840.4 | 5,152.8 | 5,388.8 | 6,116.5 | 5,257.8 | 5,760.2 | 6,310.6 | 6,913.5 | 7,574.0 | 8,297.7 |
| Revenue Growth, % | 0 | 34.17 | 4.58 | 13.5 | -14.04 | 9.55 | 9.55 | 9.55 | 9.55 | 9.55 |
| EBITDA | 546.5 | 729.1 | 764.9 | 806.7 | 622.2 | 778.7 | 853.1 | 934.7 | 1,024.0 | 1,121.8 |
| EBITDA, % | 14.23 | 14.15 | 14.19 | 13.19 | 11.83 | 13.52 | 13.52 | 13.52 | 13.52 | 13.52 |
| Depreciation | 111.8 | 155.1 | 197.0 | 180.8 | 190.3 | 186.1 | 203.9 | 223.4 | 244.7 | 268.1 |
| Depreciation, % | 2.91 | 3.01 | 3.66 | 2.96 | 3.62 | 3.23 | 3.23 | 3.23 | 3.23 | 3.23 |
| EBIT | 434.6 | 574.0 | 567.9 | 625.9 | 431.9 | 592.6 | 649.3 | 711.3 | 779.3 | 853.7 |
| EBIT, % | 11.32 | 11.14 | 10.54 | 10.23 | 8.22 | 10.29 | 10.29 | 10.29 | 10.29 | 10.29 |
| Total Cash | 1,149.4 | 870.2 | 985.0 | 1,287.1 | 1,364.0 | 1,291.2 | 1,414.6 | 1,549.7 | 1,697.8 | 1,860.0 |
| Total Cash, percent | .0 | .0 | .0 | .0 | .0 | .0 | .0 | .0 | .0 | .0 |
| Account Receivables | 791.7 | 1,194.7 | 1,228.5 | 1,617.1 | 1,527.7 | 1,406.6 | 1,540.9 | 1,688.2 | 1,849.5 | 2,026.2 |
| Account Receivables, % | 20.62 | 23.19 | 22.8 | 26.44 | 29.06 | 24.42 | 24.42 | 24.42 | 24.42 | 24.42 |
| Inventories | 328.7 | 387.6 | 305.1 | 220.4 | 252.4 | 347.3 | 380.5 | 416.9 | 456.7 | 500.3 |
| Inventories, % | 8.56 | 7.52 | 5.66 | 3.6 | 4.8 | 6.03 | 6.03 | 6.03 | 6.03 | 6.03 |
| Accounts Payable | 648.4 | 801.1 | 267.6 | 1,167.2 | 1,192.0 | 911.8 | 998.9 | 1,094.4 | 1,198.9 | 1,313.5 |
| Accounts Payable, % | 16.88 | 15.55 | 4.97 | 19.08 | 22.67 | 15.83 | 15.83 | 15.83 | 15.83 | 15.83 |
| Capital Expenditure | -421.2 | -524.2 | -399.4 | -423.7 | -275.1 | -469.0 | -513.8 | -562.9 | -616.7 | -675.6 |
| Capital Expenditure, % | -10.97 | -10.17 | -7.41 | -6.93 | -5.23 | -8.14 | -8.14 | -8.14 | -8.14 | -8.14 |
| Tax Rate, % | 8.14 | 8.14 | 8.14 | 8.14 | 8.14 | 8.14 | 8.14 | 8.14 | 8.14 | 8.14 |
| EBITAT | 400.4 | 527.9 | 528.9 | 598.4 | 396.8 | 550.8 | 603.4 | 661.1 | 724.2 | 793.4 |
| Depreciation | ||||||||||
| Changes in Account Receivables | ||||||||||
| Changes in Inventories | ||||||||||
| Changes in Accounts Payable | ||||||||||
| Capital Expenditure | ||||||||||
| UFCF | -381.0 | -150.3 | -158.3 | 951.2 | 394.1 | 14.0 | 213.0 | 233.4 | 255.7 | 280.1 |
| WACC, % | 11.71 | 11.71 | 11.72 | 11.72 | 11.71 | 11.71 | 11.71 | 11.71 | 11.71 | 11.71 |
| PV UFCF | ||||||||||
| SUM PV UFCF | 675.7 | |||||||||
| Long Term Growth Rate, % | 3.00 | |||||||||
| Free cash flow (T + 1) | 288 | |||||||||
| Terminal Value | 3,310 | |||||||||
| Present Terminal Value | 1,903 | |||||||||
| Enterprise Value | 2,578 | |||||||||
| Net Debt | -350 | |||||||||
| Equity Value | 2,928 | |||||||||
| Diluted Shares Outstanding, MM | 433 | |||||||||
| Equity Value Per Share | 6.76 |
Benefits You Will Receive
- Comprehensive Zbom Financials: Access to both historical and projected data for precise valuation.
- Customizable Inputs: Adjust parameters such as WACC, tax rates, revenue growth, and capital expenditures.
- Instant Calculations: Dynamic computation of intrinsic value and NPV at your fingertips.
- Scenario Simulation: Evaluate various scenarios to assess Zbom's future performance.
- User-Friendly Interface: Designed for professionals, yet simple enough for novices.
Key Features
- 🔍 Real-Life Zbom Financials: Pre-filled historical and projected data for Zbom Home Collection Co.,Ltd (603801SS).
- ✏️ Fully Customizable Inputs: Modify all essential parameters (yellow cells) such as WACC, growth %, and tax rates.
- 📊 Professional DCF Valuation: Integrated formulas compute Zbom’s intrinsic value using the Discounted Cash Flow method.
- ⚡ Instant Results: Visualize Zbom’s valuation immediately after adjustments are made.
- Scenario Analysis: Analyze and compare various financial outcomes side-by-side based on different assumptions.
How It Works
- Step 1: Download the prebuilt Excel template featuring Zbom Home Collection Co., Ltd's (603801SS) data.
- Step 2: Navigate through the pre-filled sheets to familiarize yourself with the essential metrics.
- Step 3: Modify the forecasts and assumptions within the editable yellow cells (WACC, growth, margins).
- Step 4: See the recalculated results instantly, including Zbom Home Collection Co., Ltd's (603801SS) intrinsic value.
- Step 5: Utilize the outputs to make well-informed investment decisions or create detailed reports.
Why Opt for Zbom Home Collection's Calculator?
- Efficient Time Management: Skip the hassle of building a DCF model from the ground up – our calculator is ready for immediate use.
- Enhanced Precision: Utilize trustworthy financial data and established formulas to minimize valuation errors.
- Completely Customizable: Adjust the model to align with your specific assumptions and forecasts.
- User-Friendly Design: Intuitive charts and outputs simplify the analysis of results.
- Endorsed by Professionals: Crafted for experts who value both precision and ease of use in their calculations.
Who Can Benefit from Zbom Home Collection Co., Ltd (603801SS)?
- Investors: Enhance your investment strategies with a robust valuation tool tailored for the home collection industry.
- Financial Analysts: Streamline your analysis using a customizable DCF model specifically designed for Zbom Home Collection Co., Ltd (603801SS).
- Consultants: Effortlessly modify the template for impactful presentations or insightful reports for your clients.
- Finance Enthusiasts: Expand your knowledge of valuation methods through practical, industry-specific examples.
- Educators and Students: Utilize this resource as a valuable teaching aid in finance and business courses.
Contents of the Template
- Pre-Filled DCF Model: Zbom Home Collection Co., Ltd’s financial data preloaded for immediate analysis.
- WACC Calculator: Comprehensive calculations for Weighted Average Cost of Capital.
- Financial Ratios: Assess Zbom Home Collection Co., Ltd's profitability, leverage, and efficiency metrics.
- Editable Inputs: Modify assumptions such as growth rates, margins, and CAPEX to suit your specific scenarios.
- Financial Statements: Annual and quarterly reports to facilitate in-depth financial analysis.
- Interactive Dashboard: Effortlessly visualize crucial valuation metrics and outcomes.
Disclaimer
All information, articles, and product details provided on this website are for general informational and educational purposes only. We do not claim any ownership over, nor do we intend to infringe upon, any trademarks, copyrights, logos, brand names, or other intellectual property mentioned or depicted on this site. Such intellectual property remains the property of its respective owners, and any references here are made solely for identification or informational purposes, without implying any affiliation, endorsement, or partnership.
We make no representations or warranties, express or implied, regarding the accuracy, completeness, or suitability of any content or products presented. Nothing on this website should be construed as legal, tax, investment, financial, medical, or other professional advice. In addition, no part of this site—including articles or product references—constitutes a solicitation, recommendation, endorsement, advertisement, or offer to buy or sell any securities, franchises, or other financial instruments, particularly in jurisdictions where such activity would be unlawful.
All content is of a general nature and may not address the specific circumstances of any individual or entity. It is not a substitute for professional advice or services. Any actions you take based on the information provided here are strictly at your own risk. You accept full responsibility for any decisions or outcomes arising from your use of this website and agree to release us from any liability in connection with your use of, or reliance upon, the content or products found herein.