
|
Shandong Buchang Pharmaceuticals Co., Ltd. (603858.SS) Évaluation DCF |
Entièrement Modifiable: Adapté À Vos Besoins Dans Excel Ou Sheets
Conception Professionnelle: Modèles Fiables Et Conformes Aux Normes Du Secteur
Pré-Construits Pour Une Utilisation Rapide Et Efficace
Compatible MAC/PC, entièrement débloqué
Aucune Expertise N'Est Requise; Facile À Suivre
Shandong Buchang Pharmaceuticals Co., Ltd. (603858.SS) Bundle
Découvrez le véritable potentiel de Shandong Buchang Pharmaceuticals Co., Ltd. (603858SS) avec notre calculatrice avancée DCF! Ajustez les hypothèses clés, explorez divers scénarios et évaluez comment les changements influencent la valorisation de Shandong Buchang Pharmaceuticals Co., Ltd. (603858SS) - le tout dans un seul modèle Excel.
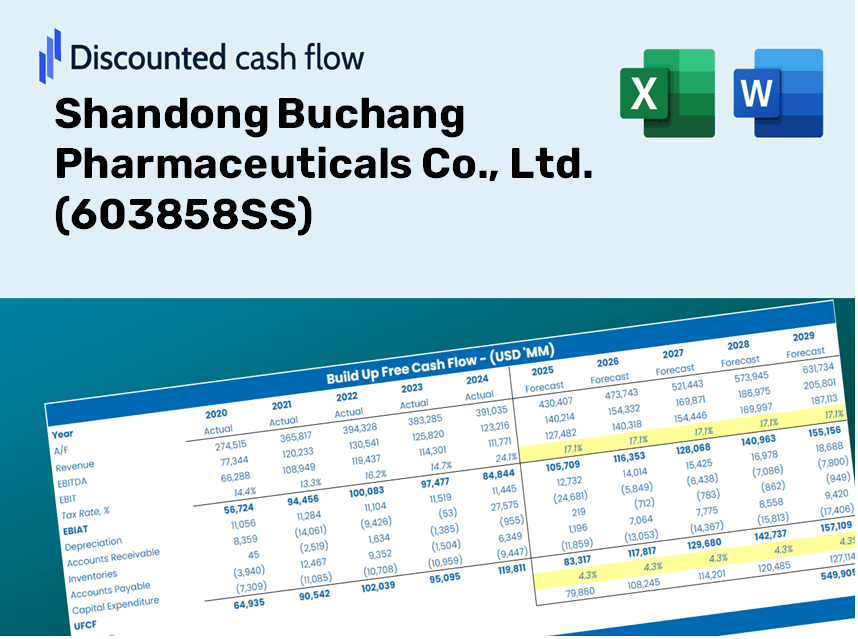
Discounted Cash Flow (DCF) - (USD MM)
| Year | AY1 2020 |
AY2 2021 |
AY3 2022 |
AY4 2023 |
AY5 2024 |
FY1 2025 |
FY2 2026 |
FY3 2027 |
FY4 2028 |
FY5 2029 |
|---|---|---|---|---|---|---|---|---|---|---|
| Revenue | 16,006.7 | 15,762.7 | 14,951.3 | 13,245.1 | 11,005.8 | 10,043.1 | 9,164.5 | 8,362.8 | 7,631.3 | 6,963.7 |
| Revenue Growth, % | 0 | -1.52 | -5.15 | -11.41 | -16.91 | -8.75 | -8.75 | -8.75 | -8.75 | -8.75 |
| EBITDA | 2,711.4 | 2,233.1 | 2,255.8 | 1,612.0 | 1,115.4 | 1,375.9 | 1,255.5 | 1,145.7 | 1,045.5 | 954.0 |
| EBITDA, % | 16.94 | 14.17 | 15.09 | 12.17 | 10.13 | 13.7 | 13.7 | 13.7 | 13.7 | 13.7 |
| Depreciation | 424.5 | 492.4 | 480.0 | 576.5 | 434.7 | 347.3 | 316.9 | 289.2 | 263.9 | 240.8 |
| Depreciation, % | 2.65 | 3.12 | 3.21 | 4.35 | 3.95 | 3.46 | 3.46 | 3.46 | 3.46 | 3.46 |
| EBIT | 2,286.8 | 1,740.7 | 1,775.9 | 1,035.5 | 680.7 | 1,028.6 | 938.6 | 856.5 | 781.6 | 713.2 |
| EBIT, % | 14.29 | 11.04 | 11.88 | 7.82 | 6.18 | 10.24 | 10.24 | 10.24 | 10.24 | 10.24 |
| Total Cash | 1,856.1 | 1,715.9 | 2,875.1 | 1,048.2 | 1,222.6 | 1,219.9 | 1,113.2 | 1,015.8 | 927.0 | 845.9 |
| Total Cash, percent | .0 | .0 | .0 | .0 | .0 | .0 | .0 | .0 | .0 | .0 |
| Account Receivables | 2,963.5 | 2,372.0 | 1,905.2 | 2,039.1 | 1,372.5 | 1,489.8 | 1,359.5 | 1,240.6 | 1,132.0 | 1,033.0 |
| Account Receivables, % | 18.51 | 15.05 | 12.74 | 15.39 | 12.47 | 14.83 | 14.83 | 14.83 | 14.83 | 14.83 |
| Inventories | 2,766.8 | 3,834.0 | 3,789.0 | 4,930.4 | 4,624.4 | 2,936.4 | 2,679.6 | 2,445.2 | 2,231.3 | 2,036.1 |
| Inventories, % | 17.29 | 24.32 | 25.34 | 37.22 | 42.02 | 29.24 | 29.24 | 29.24 | 29.24 | 29.24 |
| Accounts Payable | 1,938.2 | 2,494.6 | 2,398.3 | 2,496.5 | 2,845.6 | 1,781.2 | 1,625.4 | 1,483.2 | 1,353.5 | 1,235.1 |
| Accounts Payable, % | 12.11 | 15.83 | 16.04 | 18.85 | 25.86 | 17.74 | 17.74 | 17.74 | 17.74 | 17.74 |
| Capital Expenditure | -536.4 | -433.5 | -543.2 | -529.9 | -197.0 | -311.8 | -284.6 | -259.7 | -237.0 | -216.2 |
| Capital Expenditure, % | -3.35 | -2.75 | -3.63 | -4 | -1.79 | -3.11 | -3.11 | -3.11 | -3.11 | -3.11 |
| Tax Rate, % | -51.6 | -51.6 | -51.6 | -51.6 | -51.6 | -51.6 | -51.6 | -51.6 | -51.6 | -51.6 |
| EBITAT | 1,802.7 | 1,309.6 | 2,157.1 | 837.1 | 1,032.0 | 894.7 | 816.4 | 745.0 | 679.8 | 620.4 |
| Depreciation | ||||||||||
| Changes in Account Receivables | ||||||||||
| Changes in Inventories | ||||||||||
| Changes in Accounts Payable | ||||||||||
| Capital Expenditure | ||||||||||
| UFCF | -2,101.4 | 1,449.2 | 2,509.4 | -293.2 | 2,591.3 | 1,436.3 | 1,080.1 | 985.6 | 899.4 | 820.7 |
| WACC, % | 5.65 | 5.62 | 5.78 | 5.66 | 5.78 | 5.7 | 5.7 | 5.7 | 5.7 | 5.7 |
| PV UFCF | ||||||||||
| SUM PV UFCF | 4,503.2 | |||||||||
| Long Term Growth Rate, % | 2.00 | |||||||||
| Free cash flow (T + 1) | 837 | |||||||||
| Terminal Value | 22,641 | |||||||||
| Present Terminal Value | 17,162 | |||||||||
| Enterprise Value | 21,665 | |||||||||
| Net Debt | 1,656 | |||||||||
| Equity Value | 20,009 | |||||||||
| Diluted Shares Outstanding, MM | 1,084 | |||||||||
| Equity Value Per Share | 18.46 |
What You Will Receive
- Authentic Shandong Buchang Data: Preloaded financial information – from revenue to EBIT – utilizing real and projected figures.
- Complete Customization: Modify all essential parameters (yellow cells) such as WACC, growth %, and tax rates.
- Immediate Valuation Refresh: Automatic recalculations to assess the effects of changes on Shandong Buchang’s fair value.
- Adaptable Excel Template: Designed for quick modifications, scenario analysis, and comprehensive projections.
- Efficient and Precise: Avoid creating models from the ground up while ensuring accuracy and adaptability.
Key Features
- Pre-Loaded Data: Historical financial statements and pre-filled forecasts for Shandong Buchang Pharmaceuticals Co., Ltd. (603858SS).
- Fully Adjustable Inputs: Customize WACC, tax rates, revenue growth, and EBITDA margins as needed.
- Instant Results: View the intrinsic value of Shandong Buchang Pharmaceuticals Co., Ltd. (603858SS) recalculating in real time.
- Clear Visual Outputs: Intuitive dashboard charts illustrate valuation results and essential metrics.
- Built for Accuracy: A professional-grade tool designed for analysts, investors, and finance professionals.
How It Functions
- Step 1: Download the Excel spreadsheet.
- Step 2: Examine the pre-filled data for Shandong Buchang Pharmaceuticals (603858SS), including historical and forecasted figures.
- Step 3: Modify the key assumptions (highlighted in yellow) according to your analysis.
- Step 4: Observe the automatic updates for the intrinsic value of Shandong Buchang Pharmaceuticals (603858SS).
- Step 5: Utilize the results for your investment choices or reporting needs.
Why Choose This Tool for Shandong Buchang Pharmaceuticals (603858SS)?
- All-in-One Solution: Combines DCF, WACC, and financial ratio assessments in a single platform.
- Flexible Inputs: Modify the highlighted fields to explore different financial scenarios.
- In-Depth Analysis: Automatically computes the intrinsic value and Net Present Value for Shandong Buchang Pharmaceuticals.
- Preloaded Information: Historical and projected data provide reliable starting points for analysis.
- High-Quality Standards: Perfect for financial analysts, investors, and business advisors focused on pharmaceuticals.
Who Can Benefit from Shandong Buchang Pharmaceuticals Co., Ltd. (603858SS)?
- Investors: Make informed choices with a comprehensive valuation tool tailored for pharmaceuticals.
- Financial Analysts: Streamline your analysis with a ready-to-use DCF model that allows for easy customization.
- Consultants: Efficiently modify the template for client reports or presentations in the healthcare sector.
- Finance Enthusiasts: Enhance your knowledge of valuation methods through practical case studies from the pharmaceutical industry.
- Educators and Students: Utilize it as a valuable resource for learning in finance and pharmaceutical-related programs.
Contents of the Template
- Operating and Balance Sheet Data: Pre-filled historical data and forecasts for Shandong Buchang Pharmaceuticals (603858SS), including revenue, EBITDA, EBIT, and capital expenditures.
- WACC Calculation: A specific sheet for calculating Weighted Average Cost of Capital (WACC), featuring parameters such as Beta, risk-free rate, and share price.
- DCF Valuation (Unlevered and Levered): Customizable Discounted Cash Flow models presenting intrinsic value with comprehensive calculations.
- Financial Statements: Pre-loaded financial statements (annual and quarterly) to facilitate detailed analysis.
- Key Ratios: Provides profitability, leverage, and efficiency ratios relevant to Shandong Buchang Pharmaceuticals (603858SS).
- Dashboard and Charts: Visual representation of valuation outputs and assumptions for straightforward analysis of results.
Disclaimer
All information, articles, and product details provided on this website are for general informational and educational purposes only. We do not claim any ownership over, nor do we intend to infringe upon, any trademarks, copyrights, logos, brand names, or other intellectual property mentioned or depicted on this site. Such intellectual property remains the property of its respective owners, and any references here are made solely for identification or informational purposes, without implying any affiliation, endorsement, or partnership.
We make no representations or warranties, express or implied, regarding the accuracy, completeness, or suitability of any content or products presented. Nothing on this website should be construed as legal, tax, investment, financial, medical, or other professional advice. In addition, no part of this site—including articles or product references—constitutes a solicitation, recommendation, endorsement, advertisement, or offer to buy or sell any securities, franchises, or other financial instruments, particularly in jurisdictions where such activity would be unlawful.
All content is of a general nature and may not address the specific circumstances of any individual or entity. It is not a substitute for professional advice or services. Any actions you take based on the information provided here are strictly at your own risk. You accept full responsibility for any decisions or outcomes arising from your use of this website and agree to release us from any liability in connection with your use of, or reliance upon, the content or products found herein.