
|
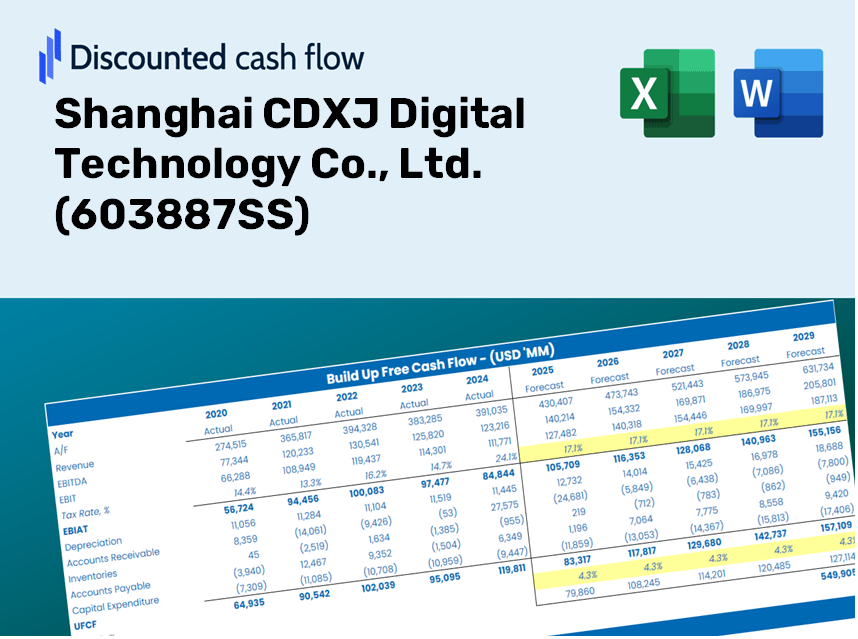
Shanghai CDXJ Digital Technology Co., Ltd. (603887.SS) Évaluation DCF |
Entièrement Modifiable: Adapté À Vos Besoins Dans Excel Ou Sheets
Conception Professionnelle: Modèles Fiables Et Conformes Aux Normes Du Secteur
Pré-Construits Pour Une Utilisation Rapide Et Efficace
Compatible MAC/PC, entièrement débloqué
Aucune Expertise N'Est Requise; Facile À Suivre
Shanghai CDXJ Digital Technology Co., Ltd. (603887.SS) Bundle
Vous cherchez à évaluer la valeur intrinsèque de Shanghai CDXJ Digital Technology Co., Ltd.? Notre calculatrice DCF (603887SS) intègre des données réelles avec des fonctionnalités de personnalisation complètes, vous permettant d'affiner vos prévisions et de faire des choix d'investissement plus éclairés.
Discounted Cash Flow (DCF) - (USD MM)
| Year | AY1 2020 |
AY2 2021 |
AY3 2022 |
AY4 2023 |
AY5 2024 |
FY1 2025 |
FY2 2026 |
FY3 2027 |
FY4 2028 |
FY5 2029 |
|---|---|---|---|---|---|---|---|---|---|---|
| Revenue | 3,933.4 | 2,907.2 | 2,683.6 | 2,432.6 | 1,621.0 | 1,311.0 | 1,060.3 | 857.5 | 693.5 | 560.9 |
| Revenue Growth, % | 0 | -26.09 | -7.69 | -9.35 | -33.36 | -19.12 | -19.12 | -19.12 | -19.12 | -19.12 |
| EBITDA | 598.4 | 172.5 | 199.0 | 48.5 | -22.2 | 76.5 | 61.9 | 50.1 | 40.5 | 32.7 |
| EBITDA, % | 15.21 | 5.93 | 7.42 | 1.99 | -1.37 | 5.84 | 5.84 | 5.84 | 5.84 | 5.84 |
| Depreciation | 85.3 | 89.7 | 93.7 | 114.6 | 119.5 | 54.6 | 44.2 | 35.7 | 28.9 | 23.4 |
| Depreciation, % | 2.17 | 3.08 | 3.49 | 4.71 | 7.37 | 4.17 | 4.17 | 4.17 | 4.17 | 4.17 |
| EBIT | 513.1 | 82.8 | 105.3 | -66.1 | -141.7 | 21.9 | 17.7 | 14.3 | 11.6 | 9.4 |
| EBIT, % | 13.04 | 2.85 | 3.93 | -2.72 | -8.74 | 1.67 | 1.67 | 1.67 | 1.67 | 1.67 |
| Total Cash | 2,242.2 | 1,362.8 | 941.8 | 1,073.8 | 667.6 | 588.1 | 475.6 | 384.7 | 311.1 | 251.6 |
| Total Cash, percent | .0 | .0 | .0 | .0 | .0 | .0 | .0 | .0 | .0 | .0 |
| Account Receivables | 3,191.4 | 3,224.2 | 3,029.2 | 2,503.4 | 1,788.3 | 1,261.5 | 1,020.3 | 825.1 | 667.3 | 539.7 |
| Account Receivables, % | 81.14 | 110.9 | 112.88 | 102.91 | 110.32 | 96.23 | 96.23 | 96.23 | 96.23 | 96.23 |
| Inventories | 367.2 | 456.3 | 640.0 | 518.8 | 802.5 | 313.9 | 253.9 | 205.3 | 166.0 | 134.3 |
| Inventories, % | 9.34 | 15.7 | 23.85 | 21.33 | 49.51 | 23.94 | 23.94 | 23.94 | 23.94 | 23.94 |
| Accounts Payable | 1,663.9 | 1,289.5 | 1,521.3 | 1,182.4 | 1,400.8 | 729.9 | 590.3 | 477.4 | 386.1 | 312.3 |
| Accounts Payable, % | 42.3 | 44.35 | 56.69 | 48.61 | 86.41 | 55.67 | 55.67 | 55.67 | 55.67 | 55.67 |
| Capital Expenditure | -235.2 | -461.8 | -450.9 | -211.2 | -1,105.3 | -302.9 | -245.0 | -198.1 | -160.2 | -129.6 |
| Capital Expenditure, % | -5.98 | -15.89 | -16.8 | -8.68 | -68.19 | -23.11 | -23.11 | -23.11 | -23.11 | -23.11 |
| Tax Rate, % | 4.41 | 4.41 | 4.41 | 4.41 | 4.41 | 4.41 | 4.41 | 4.41 | 4.41 | 4.41 |
| EBITAT | 436.5 | 79.3 | -12.4 | -62.0 | -135.4 | 16.2 | 13.1 | 10.6 | 8.6 | 6.9 |
| Depreciation | ||||||||||
| Changes in Account Receivables | ||||||||||
| Changes in Inventories | ||||||||||
| Changes in Accounts Payable | ||||||||||
| Capital Expenditure | ||||||||||
| UFCF | -1,608.1 | -789.2 | -126.4 | 149.4 | -471.5 | 112.4 | -26.0 | -21.0 | -17.0 | -13.8 |
| WACC, % | 5.07 | 5.24 | 3.66 | 5.21 | 5.24 | 4.88 | 4.88 | 4.88 | 4.88 | 4.88 |
| PV UFCF | ||||||||||
| SUM PV UFCF | 40.4 | |||||||||
| Long Term Growth Rate, % | 4.00 | |||||||||
| Free cash flow (T + 1) | -14 | |||||||||
| Terminal Value | -1,620 | |||||||||
| Present Terminal Value | -1,276 | |||||||||
| Enterprise Value | -1,236 | |||||||||
| Net Debt | 1,359 | |||||||||
| Equity Value | -2,595 | |||||||||
| Diluted Shares Outstanding, MM | 495 | |||||||||
| Equity Value Per Share | -5.24 |
What You Will Receive
- Authentic Shanghai CDXJ Data: Comprehensive financials – from revenue to EBIT – based on real and projected metrics.
- Complete Customization: Modify all essential parameters (yellow cells) such as WACC, growth %, and tax rates.
- Immediate Valuation Updates: Automatic recalculations to evaluate the effects of changes on Shanghai CDXJ’s fair value.
- Flexible Excel Template: Designed for easy modifications, scenario analysis, and in-depth projections.
- Efficient and Precise: Eliminate the need to create models from scratch while ensuring accuracy and adaptability.
Key Features
- 🔍 Real-Life CDXJ Financials: Pre-filled historical and projected data for Shanghai CDXJ Digital Technology Co., Ltd. (603887SS).
- ✏️ Fully Customizable Inputs: Modify all essential parameters (yellow cells) such as WACC, growth %, and tax rates.
- 📊 Professional DCF Valuation: Integrated formulas calculate the intrinsic value of CDXJ using the Discounted Cash Flow method.
- ⚡ Instant Results: Visualize CDXJ's valuation in real-time as you make adjustments.
- Scenario Analysis: Explore and compare various financial outcomes based on different assumptions side-by-side.
How It Operates
- Download the Template: Gain immediate access to the Excel-based Shanghai CDXJ DCF Calculator.
- Input Your Assumptions: Modify the yellow-highlighted cells for growth rates, WACC, margins, and other variables.
- Instant Calculations: The model will automatically refresh to show the intrinsic value of Shanghai CDXJ (603887SS).
- Test Scenarios: Experiment with various assumptions to assess potential changes in valuation.
- Analyze and Decide: Leverage the results to inform your investment or financial strategies.
Why Opt for This Calculator?
- Reliable Data: Access to authentic financial figures from Shanghai CDXJ Digital Technology Co., Ltd. ensures trustworthy valuation results.
- Flexible Options: Tailor essential parameters such as growth rates, WACC, and tax rates to align with your forecasts.
- Efficient: Built-in calculations save you the hassle of starting from the beginning.
- Expert-Level Tool: Crafted for investors, analysts, and consultants alike.
- Easy to Use: User-friendly design and clear, step-by-step guidance make it accessible for everyone.
Who Can Benefit from This Product?
- Investors: Evaluate the valuation of Shanghai CDXJ Digital Technology Co., Ltd. (603887SS) for informed stock trading decisions.
- CFOs and Financial Analysts: Optimize valuation methodologies and assess financial forecasts.
- Startup Founders: Gain insights into the valuation approaches used by leading tech companies like Shanghai CDXJ Digital Technology Co., Ltd. (603887SS).
- Consultants: Provide comprehensive valuation reports to enhance client services.
- Students and Educators: Utilize real-time data to teach and practice valuation strategies.
Contents of the Template
- Operating and Balance Sheet Data: Pre-filled historical data and forecasts for Shanghai CDXJ Digital Technology Co., Ltd. (603887SS), including revenue, EBITDA, EBIT, and capital expenditures.
- WACC Calculation: A dedicated sheet for the Weighted Average Cost of Capital (WACC), featuring parameters such as Beta, risk-free rate, and share price.
- DCF Valuation (Unlevered and Levered): Customizable Discounted Cash Flow models that detail intrinsic value along with comprehensive calculations.
- Financial Statements: Pre-loaded financial statements (both annual and quarterly) to facilitate thorough analysis.
- Key Ratios: A collection of key profitability, leverage, and efficiency ratios for Shanghai CDXJ Digital Technology Co., Ltd. (603887SS).
- Dashboard and Charts: A visual overview of valuation outputs and assumptions for easy result analysis.
Disclaimer
All information, articles, and product details provided on this website are for general informational and educational purposes only. We do not claim any ownership over, nor do we intend to infringe upon, any trademarks, copyrights, logos, brand names, or other intellectual property mentioned or depicted on this site. Such intellectual property remains the property of its respective owners, and any references here are made solely for identification or informational purposes, without implying any affiliation, endorsement, or partnership.
We make no representations or warranties, express or implied, regarding the accuracy, completeness, or suitability of any content or products presented. Nothing on this website should be construed as legal, tax, investment, financial, medical, or other professional advice. In addition, no part of this site—including articles or product references—constitutes a solicitation, recommendation, endorsement, advertisement, or offer to buy or sell any securities, franchises, or other financial instruments, particularly in jurisdictions where such activity would be unlawful.
All content is of a general nature and may not address the specific circumstances of any individual or entity. It is not a substitute for professional advice or services. Any actions you take based on the information provided here are strictly at your own risk. You accept full responsibility for any decisions or outcomes arising from your use of this website and agree to release us from any liability in connection with your use of, or reliance upon, the content or products found herein.