
|
Xinhuanet Co., Ltd. (603888.SS) Évaluation DCF |
Entièrement Modifiable: Adapté À Vos Besoins Dans Excel Ou Sheets
Conception Professionnelle: Modèles Fiables Et Conformes Aux Normes Du Secteur
Pré-Construits Pour Une Utilisation Rapide Et Efficace
Compatible MAC/PC, entièrement débloqué
Aucune Expertise N'Est Requise; Facile À Suivre
Xinhuanet Co., Ltd. (603888.SS) Bundle
Améliorez votre stratégie d'investissement avec la calculatrice [symbole] DCF! Plongez dans Authentic Xinhuanet Co., Ltd., ajustez les hypothèses et dépenses de croissance et observez instantanément comment ces modifications affectent la valeur intrinsèque [symbole].
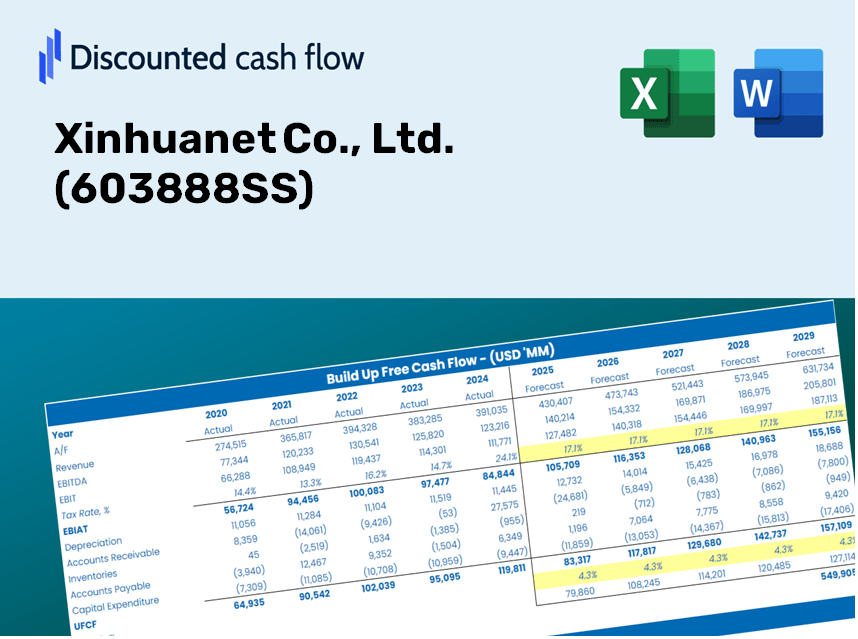
Discounted Cash Flow (DCF) - (USD MM)
| Year | AY1 2020 |
AY2 2021 |
AY3 2022 |
AY4 2023 |
AY5 2024 |
FY1 2025 |
FY2 2026 |
FY3 2027 |
FY4 2028 |
FY5 2029 |
|---|---|---|---|---|---|---|---|---|---|---|
| Revenue | 1,433.4 | 1,724.1 | 1,940.6 | 2,081.9 | 2,141.8 | 2,372.1 | 2,627.1 | 2,909.5 | 3,222.2 | 3,568.6 |
| Revenue Growth, % | 0 | 20.28 | 12.56 | 7.28 | 2.88 | 10.75 | 10.75 | 10.75 | 10.75 | 10.75 |
| EBITDA | 127.6 | 115.9 | 197.4 | 172.3 | 237.4 | 214.2 | 237.3 | 262.8 | 291.0 | 322.3 |
| EBITDA, % | 8.9 | 6.72 | 10.17 | 8.27 | 11.08 | 9.03 | 9.03 | 9.03 | 9.03 | 9.03 |
| Depreciation | 68.9 | 86.3 | 89.1 | 73.8 | 46.6 | 95.5 | 105.7 | 117.1 | 129.7 | 143.6 |
| Depreciation, % | 4.81 | 5.01 | 4.59 | 3.54 | 2.17 | 4.02 | 4.02 | 4.02 | 4.02 | 4.02 |
| EBIT | 58.7 | 29.6 | 108.3 | 98.5 | 190.8 | 118.8 | 131.5 | 145.7 | 161.3 | 178.7 |
| EBIT, % | 4.09 | 1.72 | 5.58 | 4.73 | 8.91 | 5.01 | 5.01 | 5.01 | 5.01 | 5.01 |
| Total Cash | 2,477.7 | 2,845.7 | 3,182.4 | 3,387.8 | 2,475.0 | 2,372.1 | 2,627.1 | 2,909.5 | 3,222.2 | 3,568.6 |
| Total Cash, percent | .0 | .0 | .0 | .0 | .0 | .0 | .0 | .0 | .0 | .0 |
| Account Receivables | 489.7 | 435.7 | 485.4 | 581.5 | 468.4 | 636.9 | 705.4 | 781.2 | 865.2 | 958.2 |
| Account Receivables, % | 34.16 | 25.27 | 25.01 | 27.93 | 21.87 | 26.85 | 26.85 | 26.85 | 26.85 | 26.85 |
| Inventories | 2.6 | 16.7 | 15.7 | 9.3 | 7.8 | 13.2 | 14.6 | 16.1 | 17.9 | 19.8 |
| Inventories, % | 0.18081 | 0.97145 | 0.80986 | 0.44804 | 0.36484 | 0.555 | 0.555 | 0.555 | 0.555 | 0.555 |
| Accounts Payable | 173.9 | 266.7 | 447.1 | 530.3 | 594.7 | 492.8 | 545.8 | 604.4 | 669.4 | 741.4 |
| Accounts Payable, % | 12.13 | 15.47 | 23.04 | 25.47 | 27.76 | 20.77 | 20.77 | 20.77 | 20.77 | 20.77 |
| Capital Expenditure | -127.4 | -93.1 | -47.3 | -30.9 | -1,023.5 | -313.1 | -346.7 | -384.0 | -425.3 | -471.0 |
| Capital Expenditure, % | -8.89 | -5.4 | -2.44 | -1.48 | -47.79 | -13.2 | -13.2 | -13.2 | -13.2 | -13.2 |
| Tax Rate, % | 36.24 | 36.24 | 36.24 | 36.24 | 36.24 | 36.24 | 36.24 | 36.24 | 36.24 | 36.24 |
| EBITAT | 60.7 | 30.3 | 105.6 | 148.4 | 121.7 | 109.6 | 121.3 | 134.4 | 148.8 | 164.8 |
| Depreciation | ||||||||||
| Changes in Account Receivables | ||||||||||
| Changes in Inventories | ||||||||||
| Changes in Accounts Payable | ||||||||||
| Capital Expenditure | ||||||||||
| UFCF | -316.2 | 156.3 | 279.1 | 184.7 | -676.2 | -383.8 | -136.6 | -151.3 | -167.5 | -185.5 |
| WACC, % | 7.44 | 7.44 | 7.44 | 7.44 | 7.43 | 7.44 | 7.44 | 7.44 | 7.44 | 7.44 |
| PV UFCF | ||||||||||
| SUM PV UFCF | -852.9 | |||||||||
| Long Term Growth Rate, % | 3.00 | |||||||||
| Free cash flow (T + 1) | -191 | |||||||||
| Terminal Value | -4,308 | |||||||||
| Present Terminal Value | -3,010 | |||||||||
| Enterprise Value | -3,863 | |||||||||
| Net Debt | -2,354 | |||||||||
| Equity Value | -1,509 | |||||||||
| Diluted Shares Outstanding, MM | 675 | |||||||||
| Equity Value Per Share | -2.24 |
Benefits of Choosing Xinhuanet Co., Ltd. (603888SS)
- Flexible Forecast Inputs: Modify key assumptions (growth %, margins, WACC) effortlessly to explore various scenarios.
- Actual Market Data: Pre-loaded financial data for Xinhuanet Co., Ltd. to accelerate your analysis.
- Instant DCF Results: The template automatically calculates Net Present Value (NPV) and intrinsic value for you.
- Tailored and Professional: A refined Excel model designed to meet your valuation requirements.
- Designed for Analysts and Investors: Perfect for evaluating projections, confirming strategies, and enhancing efficiency.
Key Features
- Comprehensive DCF Calculator: Offers detailed unlevered and levered DCF valuation models tailored for Xinhuanet Co., Ltd. (603888SS).
- WACC Calculator: Comes with a pre-configured Weighted Average Cost of Capital sheet featuring customizable parameters.
- Adjustable Forecast Assumptions: Easily alter growth projections, capital expenditures, and discount rates.
- Integrated Financial Ratios: Evaluate profitability, leverage, and efficiency ratios specific to Xinhuanet Co., Ltd. (603888SS).
- Interactive Dashboard and Charts: Visual summaries present vital valuation metrics for straightforward analysis.
How It Functions
- Download the Template: Obtain immediate access to the Excel-based Xinhuanet Co., Ltd. (603888SS) DCF Calculator.
- Input Your Assumptions: Modify the yellow-highlighted cells for growth rates, WACC, margins, and other variables.
- Instant Calculations: The model automatically refreshes Xinhuanet's intrinsic value.
- Test Scenarios: Experiment with different assumptions to assess potential changes in valuation.
- Analyze and Decide: Utilize the results to inform your investment or financial analysis.
Why Opt for Xinhuanet Co., Ltd. Calculator?
- User-Friendly and Accessible: Tailored for both novices and seasoned users.
- Customizable Parameters: Easily adjust inputs to suit your specific analysis needs.
- Real-Time Updates: Observe immediate changes in Xinhuanet’s valuation with input modifications.
- Pre-Configured: Comes with Xinhuanet’s actual financial information for swift evaluations.
- Reliably Used by Experts: Favored by analysts and investors for making well-informed choices.
Who Should Utilize Xinhuanet Co., Ltd. (603888SS)?
- Finance Students: Discover financial analysis techniques and apply them using real-world data specific to Xinhuanet Co., Ltd. (603888SS).
- Academics: Integrate professional financial models into your academic programs or research surrounding Xinhuanet Co., Ltd. (603888SS).
- Investors: Evaluate your investment strategies and analyze the valuation metrics of Xinhuanet Co., Ltd. (603888SS).
- Analysts: Enhance your analysis efficiency with a customizable financial model tailored for Xinhuanet Co., Ltd. (603888SS).
- Small Business Owners: Learn how major corporations like Xinhuanet Co., Ltd. (603888SS) are appraised and leveraged in the market.
Overview of Template Features
- Preloaded XHNT Data: Historical and forecasted financial metrics, including revenue, EBIT, and capital expenditures.
- DCF and WACC Models: Advanced templates for determining intrinsic value and Weighted Average Cost of Capital.
- Customizable Inputs: Yellow-highlighted fields for modifying revenue growth, tax rates, and discount rates.
- Financial Statements: Detailed annual and quarterly financial data for thorough analysis.
- Key Ratios: Indicators for profitability, leverage, and efficiency to assess performance.
- Dashboard and Charts: Visual representations of valuation results and underlying assumptions.
Disclaimer
All information, articles, and product details provided on this website are for general informational and educational purposes only. We do not claim any ownership over, nor do we intend to infringe upon, any trademarks, copyrights, logos, brand names, or other intellectual property mentioned or depicted on this site. Such intellectual property remains the property of its respective owners, and any references here are made solely for identification or informational purposes, without implying any affiliation, endorsement, or partnership.
We make no representations or warranties, express or implied, regarding the accuracy, completeness, or suitability of any content or products presented. Nothing on this website should be construed as legal, tax, investment, financial, medical, or other professional advice. In addition, no part of this site—including articles or product references—constitutes a solicitation, recommendation, endorsement, advertisement, or offer to buy or sell any securities, franchises, or other financial instruments, particularly in jurisdictions where such activity would be unlawful.
All content is of a general nature and may not address the specific circumstances of any individual or entity. It is not a substitute for professional advice or services. Any actions you take based on the information provided here are strictly at your own risk. You accept full responsibility for any decisions or outcomes arising from your use of this website and agree to release us from any liability in connection with your use of, or reliance upon, the content or products found herein.