
|
Jiangxi Guotai Group Co., Ltd. (603977.SS) Évaluation DCF |
Entièrement Modifiable: Adapté À Vos Besoins Dans Excel Ou Sheets
Conception Professionnelle: Modèles Fiables Et Conformes Aux Normes Du Secteur
Pré-Construits Pour Une Utilisation Rapide Et Efficace
Compatible MAC/PC, entièrement débloqué
Aucune Expertise N'Est Requise; Facile À Suivre
Jiangxi Guotai Group Co.,Ltd. (603977.SS) Bundle
Rationalisez votre analyse et améliorez la précision avec notre calculatrice DCF (603977SS)! En utilisant des données réelles de Jiangxi Guotai Group Co., Ltd. et des hypothèses personnalisables, cet outil vous permet de prévoir, analyser et valoriser l'entreprise comme un investisseur chevronné.
Discounted Cash Flow (DCF) - (USD MM)
| Year | AY1 2020 |
AY2 2021 |
AY3 2022 |
AY4 2023 |
AY5 2024 |
FY1 2025 |
FY2 2026 |
FY3 2027 |
FY4 2028 |
FY5 2029 |
|---|---|---|---|---|---|---|---|---|---|---|
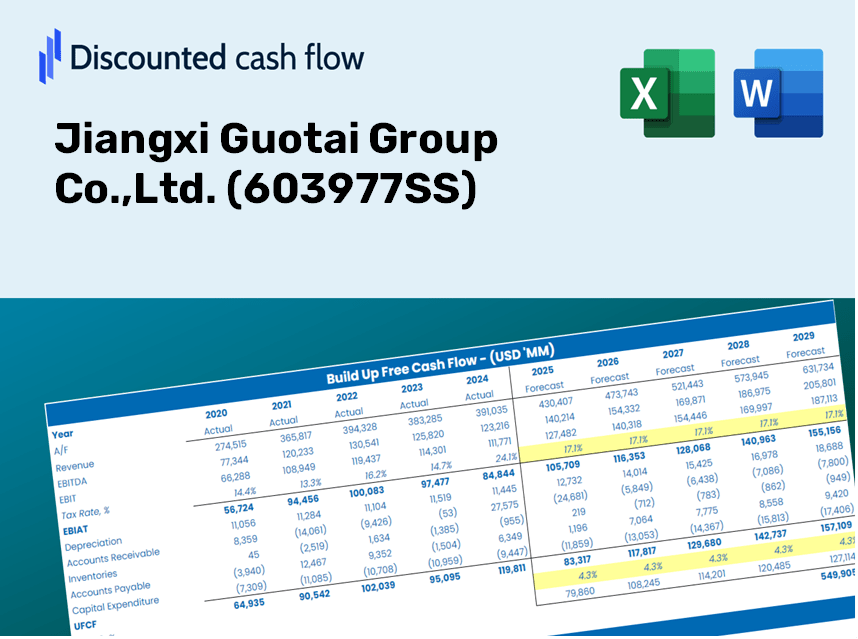
| Revenue | 1,704.4 | 1,988.1 | 2,152.5 | 2,541.0 | 2,354.5 | 2,564.2 | 2,792.6 | 3,041.3 | 3,312.1 | 3,607.1 |
| Revenue Growth, % | 0 | 16.65 | 8.27 | 18.05 | -7.34 | 8.91 | 8.91 | 8.91 | 8.91 | 8.91 |
| EBITDA | 338.4 | 383.8 | 385.4 | 452.5 | 452.0 | 482.4 | 525.4 | 572.2 | 623.1 | 678.6 |
| EBITDA, % | 19.85 | 19.3 | 17.9 | 17.81 | 19.2 | 18.81 | 18.81 | 18.81 | 18.81 | 18.81 |
| Depreciation | 77.1 | 78.2 | 79.2 | 87.6 | 104.0 | 102.6 | 111.7 | 121.7 | 132.5 | 144.3 |
| Depreciation, % | 4.52 | 3.94 | 3.68 | 3.45 | 4.42 | 4 | 4 | 4 | 4 | 4 |
| EBIT | 261.3 | 305.6 | 306.1 | 364.9 | 348.0 | 379.8 | 413.6 | 450.5 | 490.6 | 534.3 |
| EBIT, % | 15.33 | 15.37 | 14.22 | 14.36 | 14.78 | 14.81 | 14.81 | 14.81 | 14.81 | 14.81 |
| Total Cash | 597.4 | 682.0 | 1,109.1 | 1,302.1 | 1,212.5 | 1,146.8 | 1,248.9 | 1,360.2 | 1,481.3 | 1,613.2 |
| Total Cash, percent | .0 | .0 | .0 | .0 | .0 | .0 | .0 | .0 | .0 | .0 |
| Account Receivables | 524.5 | 676.6 | 769.0 | 848.0 | 1,028.1 | 910.6 | 991.7 | 1,080.1 | 1,176.2 | 1,281.0 |
| Account Receivables, % | 30.77 | 34.03 | 35.72 | 33.37 | 43.67 | 35.51 | 35.51 | 35.51 | 35.51 | 35.51 |
| Inventories | 140.4 | 186.0 | 231.9 | 283.4 | 297.5 | 267.5 | 291.3 | 317.2 | 345.5 | 376.3 |
| Inventories, % | 8.24 | 9.36 | 10.77 | 11.15 | 12.63 | 10.43 | 10.43 | 10.43 | 10.43 | 10.43 |
| Accounts Payable | 230.1 | 445.7 | 520.6 | 355.0 | 455.3 | 479.0 | 521.7 | 568.1 | 618.7 | 673.8 |
| Accounts Payable, % | 13.5 | 22.42 | 24.18 | 13.97 | 19.34 | 18.68 | 18.68 | 18.68 | 18.68 | 18.68 |
| Capital Expenditure | -309.7 | -149.8 | -143.0 | -401.3 | -290.0 | -310.1 | -337.7 | -367.8 | -400.5 | -436.2 |
| Capital Expenditure, % | -18.17 | -7.53 | -6.65 | -15.79 | -12.32 | -12.09 | -12.09 | -12.09 | -12.09 | -12.09 |
| Tax Rate, % | 32.4 | 32.4 | 32.4 | 32.4 | 32.4 | 32.4 | 32.4 | 32.4 | 32.4 | 32.4 |
| EBITAT | 203.6 | 233.0 | 204.7 | 276.3 | 235.2 | 276.8 | 301.4 | 328.3 | 357.5 | 389.3 |
| Depreciation | ||||||||||
| Changes in Account Receivables | ||||||||||
| Changes in Inventories | ||||||||||
| Changes in Accounts Payable | ||||||||||
| Capital Expenditure | ||||||||||
| UFCF | -463.8 | 179.3 | 77.5 | -333.5 | -44.7 | 240.5 | 13.2 | 14.4 | 15.7 | 17.1 |
| WACC, % | 4.96 | 4.95 | 4.91 | 4.95 | 4.92 | 4.94 | 4.94 | 4.94 | 4.94 | 4.94 |
| PV UFCF | ||||||||||
| SUM PV UFCF | 280.0 | |||||||||
| Long Term Growth Rate, % | 2.00 | |||||||||
| Free cash flow (T + 1) | 17 | |||||||||
| Terminal Value | 592 | |||||||||
| Present Terminal Value | 465 | |||||||||
| Enterprise Value | 745 | |||||||||
| Net Debt | 155 | |||||||||
| Equity Value | 590 | |||||||||
| Diluted Shares Outstanding, MM | 623 | |||||||||
| Equity Value Per Share | 0.95 |
Benefits You Will Receive
- Pre-Loaded Financial Model: Access to Jiangxi Guotai Group Co., Ltd.'s [603977SS] real data for accurate DCF valuations.
- Comprehensive Forecast Control: Modify key factors like revenue growth, profit margins, WACC, and other essential drivers.
- Real-Time Calculations: Seamless updates allow you to see changes in results instantly as you adjust inputs.
- Professional-Grade Template: A polished Excel model tailored for high-quality valuation presentations.
- Flexible and Reusable: Designed for adaptability, enabling multiple uses for in-depth forecasting.
Key Features
- Customizable Financial Inputs: Adjust essential parameters such as revenue growth, EBITDA margin, and capital expenditures.
- Instant DCF Valuation: Automatically computes intrinsic value, NPV, and additional financial metrics.
- Industry-Leading Precision: Leverages Jiangxi Guotai Group's actual financial data for accurate valuation results.
- Simplified Scenario Analysis: Effortlessly evaluate various assumptions and analyze results side by side.
- Efficiency Boost: Avoid the hassle of constructing intricate valuation models from the ground up.
How It Works
- 1. Access the Template: Download and open the Excel file containing Jiangxi Guotai Group Co., Ltd.'s (603977SS) preloaded data.
- 2. Modify Assumptions: Update essential inputs such as growth rates, WACC, and capital expenditures tailored to Jiangxi Guotai Group Co., Ltd.
- 3. Instantly Review Results: The DCF model automatically calculates the intrinsic value and NPV for Jiangxi Guotai Group Co., Ltd.
- 4. Analyze Scenarios: Evaluate various forecasts to explore different valuation results for Jiangxi Guotai Group Co., Ltd.
- 5. Present with Assurance: Share professional valuation insights to back your strategic decisions regarding Jiangxi Guotai Group Co., Ltd.
Why Choose This Calculator?
- User-Friendly Interface: Crafted for both novices and seasoned professionals.
- Adjustable Parameters: Modify inputs with ease to suit your analysis needs.
- Real-Time Calculations: Witness immediate updates to Jiangxi Guotai Group Co., Ltd.'s valuation as you change inputs.
- Preloaded Financial Data: Comes with the company's actual financial metrics for expedited evaluations.
- Widely Respected: Trusted by analysts and investors for making well-informed financial decisions.
Who Can Benefit from This Product?
- Investors: Accurately assess the fair value of Jiangxi Guotai Group Co.,Ltd. (603977SS) before making investment moves.
- CFOs: Utilize a robust DCF model for enhanced financial reporting and analysis.
- Consultants: Efficiently customize the template for client valuation reports.
- Entrepreneurs: Acquire insights into financial modeling practices used by leading corporations.
- Educators: Employ it as a resource for teaching valuation techniques.
What the Template Includes
- Preloaded 603977SS Data: Historical and projected financial information, encompassing revenue, EBIT, and capital expenditures.
- DCF and WACC Models: Professional-grade templates for assessing intrinsic value and calculating the Weighted Average Cost of Capital.
- Editable Inputs: Cells highlighted in yellow for customizing revenue growth, tax rates, and discount rates.
- Financial Statements: Detailed annual and quarterly financials for in-depth analysis.
- Key Ratios: Metrics for profitability, leverage, and efficiency to assess performance.
- Dashboard and Charts: Visual representations of valuation results and underlying assumptions.
Disclaimer
All information, articles, and product details provided on this website are for general informational and educational purposes only. We do not claim any ownership over, nor do we intend to infringe upon, any trademarks, copyrights, logos, brand names, or other intellectual property mentioned or depicted on this site. Such intellectual property remains the property of its respective owners, and any references here are made solely for identification or informational purposes, without implying any affiliation, endorsement, or partnership.
We make no representations or warranties, express or implied, regarding the accuracy, completeness, or suitability of any content or products presented. Nothing on this website should be construed as legal, tax, investment, financial, medical, or other professional advice. In addition, no part of this site—including articles or product references—constitutes a solicitation, recommendation, endorsement, advertisement, or offer to buy or sell any securities, franchises, or other financial instruments, particularly in jurisdictions where such activity would be unlawful.
All content is of a general nature and may not address the specific circumstances of any individual or entity. It is not a substitute for professional advice or services. Any actions you take based on the information provided here are strictly at your own risk. You accept full responsibility for any decisions or outcomes arising from your use of this website and agree to release us from any liability in connection with your use of, or reliance upon, the content or products found herein.