
|
Guangdong Marubi Biotechnology Co., Ltd. (603983.SS) Évaluation DCF |
Entièrement Modifiable: Adapté À Vos Besoins Dans Excel Ou Sheets
Conception Professionnelle: Modèles Fiables Et Conformes Aux Normes Du Secteur
Pré-Construits Pour Une Utilisation Rapide Et Efficace
Compatible MAC/PC, entièrement débloqué
Aucune Expertise N'Est Requise; Facile À Suivre
Guangdong Marubi Biotechnology Co., Ltd. (603983.SS) Bundle
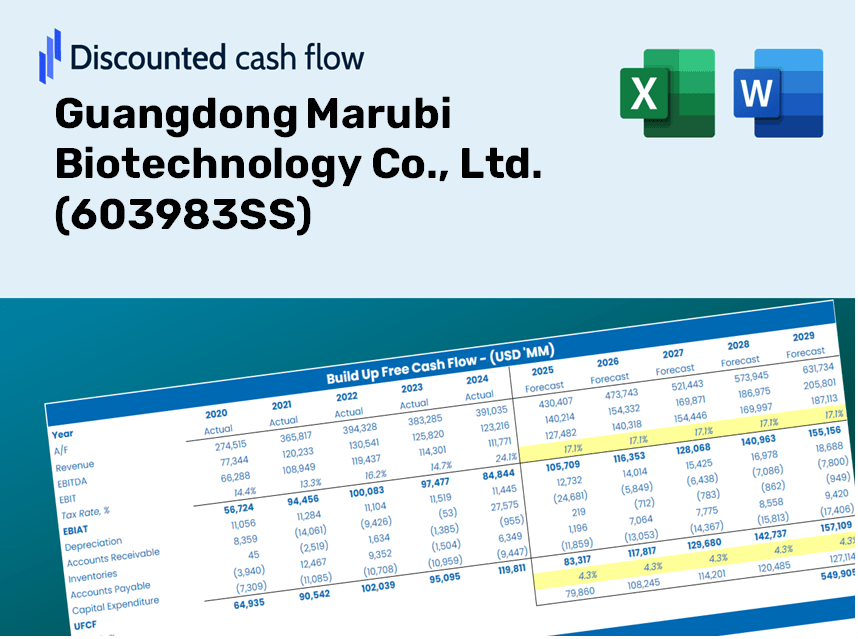
Explorez les perspectives financières de Guangdong Marubi Biotechnology Co., Ltd. (603983SS) avec notre calculatrice DCF conviviale! Entrez vos projections pour la croissance, les marges bénéficiaires et les dépenses pour calculer la valeur intrinsèque de Guangdong Marubi Biotechnology Co., Ltd. (603983SS) et informez vos décisions d'investissement.
What You Will Receive
- Genuine Guangdong Marubi Data: Preloaded financial information – covering everything from revenue to EBIT – based on actual and projected statistics.
- Comprehensive Customization: Modify all key parameters (yellow cells) such as WACC, growth %, and tax rates.
- Real-Time Valuation Updates: Automatic recalculations to evaluate the effect of changes on Guangdong Marubi’s fair value.
- Flexible Excel Template: Designed for quick modifications, scenario analysis, and in-depth projections.
- Efficient and Accurate: Eliminate the need to build models from the ground up while ensuring precision and adaptability.
Key Features
- Comprehensive Historical Data: Pre-loaded with Guangdong Marubi Biotechnology's financial history and future forecasts.
- Customizable Parameters: Tailor revenue growth rates, profit margins, WACC, tax levels, and capital expenditures to suit your analysis.
- Interactive Valuation Model: Automatic recalibration of Net Present Value (NPV) and intrinsic value in response to your custom inputs.
- Multi-Scenario Analysis: Generate various forecasting scenarios to evaluate distinct valuation results.
- Intuitive Interface: A user-friendly layout that caters to both industry professionals and newcomers.
How It Operates
- Download the Template: Gain immediate access to the Excel-based Guangdong Marubi Biotechnology Co., Ltd. (603983SS) DCF Calculator.
- Input Your Assumptions: Modify the yellow-highlighted cells for growth rates, WACC, profit margins, and additional parameters.
- Instant Calculations: The model will automatically refresh to display Guangdong Marubi’s intrinsic value.
- Test Scenarios: Experiment with various assumptions to assess potential changes in valuation.
- Analyze and Decide: Leverage the findings to inform your investment or financial analysis decisions.
Why Opt for Marubi's Solutions?
- Time-Efficient: Skip the hassle of starting from zero – our tools are ready for immediate use.
- Enhanced Precision: Accurate data and established formulas minimize valuation errors.
- Completely Customizable: Adjust the parameters to align with your specific forecasts and assumptions.
- User-Friendly: Intuitive visuals and outputs simplify data interpretation.
- Professionally Endorsed: Crafted for experts who prioritize accuracy and functionality.
Who Should Use This Product?
- Investors: Effectively evaluate the fair value of Guangdong Marubi Biotechnology Co., Ltd. (603983SS) prior to making investment choices.
- CFOs: Utilize a sophisticated DCF model for comprehensive financial reporting and analysis.
- Consultants: Seamlessly customize the template for client valuation reports.
- Entrepreneurs: Discover financial modeling strategies employed by leading companies in the biotechnology sector.
- Educators: Employ it as a pedagogical tool to illustrate various valuation approaches.
Contents of the Template
- Operating and Balance Sheet Data: Pre-filled historical data and forecasts for Guangdong Marubi Biotechnology Co., Ltd. (603983SS), including revenue, EBITDA, EBIT, and capital expenditures.
- WACC Calculation: A specific sheet for calculating the Weighted Average Cost of Capital (WACC), featuring parameters like Beta, risk-free rate, and share price.
- DCF Valuation (Unlevered and Levered): Customizable Discounted Cash Flow models that demonstrate intrinsic value with comprehensive calculations.
- Financial Statements: Pre-loaded annual and quarterly financial statements to facilitate analysis.
- Key Ratios: Includes important profitability, leverage, and efficiency ratios for Guangdong Marubi Biotechnology Co., Ltd. (603983SS).
- Dashboard and Charts: Visual representation of valuation outputs and assumptions for easy analysis of results.
Disclaimer
All information, articles, and product details provided on this website are for general informational and educational purposes only. We do not claim any ownership over, nor do we intend to infringe upon, any trademarks, copyrights, logos, brand names, or other intellectual property mentioned or depicted on this site. Such intellectual property remains the property of its respective owners, and any references here are made solely for identification or informational purposes, without implying any affiliation, endorsement, or partnership.
We make no representations or warranties, express or implied, regarding the accuracy, completeness, or suitability of any content or products presented. Nothing on this website should be construed as legal, tax, investment, financial, medical, or other professional advice. In addition, no part of this site—including articles or product references—constitutes a solicitation, recommendation, endorsement, advertisement, or offer to buy or sell any securities, franchises, or other financial instruments, particularly in jurisdictions where such activity would be unlawful.
All content is of a general nature and may not address the specific circumstances of any individual or entity. It is not a substitute for professional advice or services. Any actions you take based on the information provided here are strictly at your own risk. You accept full responsibility for any decisions or outcomes arising from your use of this website and agree to release us from any liability in connection with your use of, or reliance upon, the content or products found herein.