
|
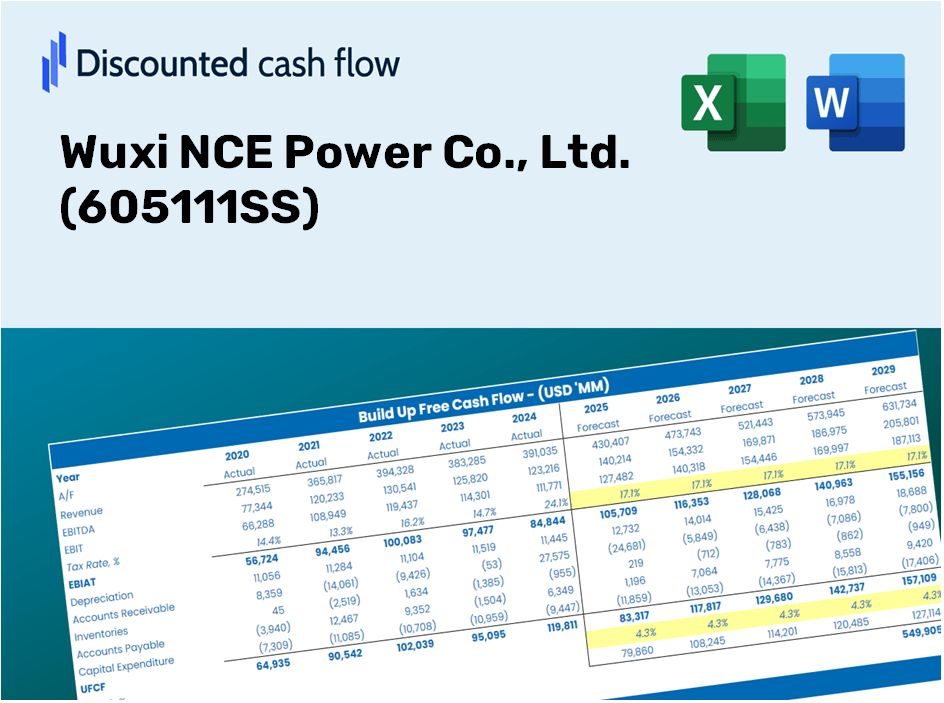
Wuxi nce Power Co., Ltd. (605111.SS) Évaluation DCF |
Entièrement Modifiable: Adapté À Vos Besoins Dans Excel Ou Sheets
Conception Professionnelle: Modèles Fiables Et Conformes Aux Normes Du Secteur
Pré-Construits Pour Une Utilisation Rapide Et Efficace
Compatible MAC/PC, entièrement débloqué
Aucune Expertise N'Est Requise; Facile À Suivre
Wuxi NCE Power Co., Ltd. (605111.SS) Bundle
Optimisez votre temps et améliorez la précision avec notre calculatrice DCF (605111SS)! En utilisant de véritables données de Wuxi nce Power Co., Ltd. et des hypothèses personnalisables, cet outil vous permet de prévoir, d'analyser et de valoriser le pouvoir Wuxi nce comme un investisseur chevronné.
Discounted Cash Flow (DCF) - (USD MM)
| Year | AY1 2020 |
AY2 2021 |
AY3 2022 |
AY4 2023 |
AY5 2024 |
FY1 2025 |
FY2 2026 |
FY3 2027 |
FY4 2028 |
FY5 2029 |
|---|---|---|---|---|---|---|---|---|---|---|
| Revenue | 955.0 | 1,510.7 | 1,810.9 | 1,476.6 | 1,828.4 | 2,209.8 | 2,670.7 | 3,227.8 | 3,901.0 | 4,714.7 |
| Revenue Growth, % | 0 | 58.19 | 19.87 | -18.46 | 23.83 | 20.86 | 20.86 | 20.86 | 20.86 | 20.86 |
| EBITDA | 156.2 | 464.3 | 469.0 | 291.5 | 468.1 | 523.0 | 632.0 | 763.9 | 923.2 | 1,115.7 |
| EBITDA, % | 16.35 | 30.73 | 25.9 | 19.74 | 25.6 | 23.67 | 23.67 | 23.67 | 23.67 | 23.67 |
| Depreciation | 9.7 | 14.3 | 24.9 | 28.0 | 28.7 | 30.1 | 36.4 | 44.0 | 53.1 | 64.2 |
| Depreciation, % | 1.02 | 0.9466 | 1.38 | 1.9 | 1.57 | 1.36 | 1.36 | 1.36 | 1.36 | 1.36 |
| EBIT | 146.5 | 450.0 | 444.0 | 263.5 | 439.4 | 492.9 | 595.7 | 719.9 | 870.1 | 1,051.5 |
| EBIT, % | 15.34 | 29.78 | 24.52 | 17.85 | 24.03 | 22.3 | 22.3 | 22.3 | 22.3 | 22.3 |
| Total Cash | 680.8 | 929.4 | 2,566.0 | 2,720.3 | 2,707.0 | 1,912.8 | 2,311.8 | 2,794.0 | 3,376.7 | 4,081.0 |
| Total Cash, percent | .0 | .0 | .0 | .0 | .0 | .0 | .0 | .0 | .0 | .0 |
| Account Receivables | 381.6 | 302.6 | 452.7 | 430.8 | 611.9 | 652.5 | 788.5 | 953.0 | 1,151.8 | 1,392.0 |
| Account Receivables, % | 39.95 | 20.03 | 25 | 29.18 | 33.47 | 29.53 | 29.53 | 29.53 | 29.53 | 29.53 |
| Inventories | 109.1 | 240.4 | 441.3 | 453.9 | 311.6 | 439.7 | 531.4 | 642.3 | 776.2 | 938.1 |
| Inventories, % | 11.43 | 15.91 | 24.37 | 30.74 | 17.04 | 19.9 | 19.9 | 19.9 | 19.9 | 19.9 |
| Accounts Payable | 171.1 | 213.6 | 87.0 | 427.7 | 301.0 | 363.7 | 439.6 | 531.2 | 642.0 | 776.0 |
| Accounts Payable, % | 17.92 | 14.14 | 4.81 | 28.97 | 16.46 | 16.46 | 16.46 | 16.46 | 16.46 | 16.46 |
| Capital Expenditure | -58.7 | -146.2 | -86.5 | -191.5 | -85.0 | -168.9 | -204.1 | -246.7 | -298.2 | -360.4 |
| Capital Expenditure, % | -6.14 | -9.68 | -4.77 | -12.97 | -4.65 | -7.64 | -7.64 | -7.64 | -7.64 | -7.64 |
| Tax Rate, % | 11.11 | 11.11 | 11.11 | 11.11 | 11.11 | 11.11 | 11.11 | 11.11 | 11.11 | 11.11 |
| EBITAT | 129.2 | 392.5 | 381.1 | 243.7 | 390.6 | 436.3 | 527.3 | 637.3 | 770.2 | 930.9 |
| Depreciation | ||||||||||
| Changes in Account Receivables | ||||||||||
| Changes in Inventories | ||||||||||
| Changes in Accounts Payable | ||||||||||
| Capital Expenditure | ||||||||||
| UFCF | -239.3 | 250.7 | -158.1 | 430.2 | 168.7 | 191.6 | 207.6 | 250.9 | 303.3 | 366.5 |
| WACC, % | 9.78 | 9.78 | 9.78 | 9.78 | 9.78 | 9.78 | 9.78 | 9.78 | 9.78 | 9.78 |
| PV UFCF | ||||||||||
| SUM PV UFCF | 975.2 | |||||||||
| Long Term Growth Rate, % | 3.00 | |||||||||
| Free cash flow (T + 1) | 378 | |||||||||
| Terminal Value | 5,570 | |||||||||
| Present Terminal Value | 3,494 | |||||||||
| Enterprise Value | 4,469 | |||||||||
| Net Debt | -2,063 | |||||||||
| Equity Value | 6,533 | |||||||||
| Diluted Shares Outstanding, MM | 414 | |||||||||
| Equity Value Per Share | 15.78 |
What You Will Receive
- Authentic Wuxi NCE Data: Preloaded financials – encompassing revenue to EBIT – derived from actual and forecasted metrics.
- Comprehensive Customization: Modify all essential parameters (yellow cells) such as WACC, growth %, and tax rates.
- Immediate Valuation Updates: Automatic recalculations to assess the effects of changes on Wuxi NCE's fair value.
- Flexible Excel Template: Designed for swift edits, scenario analysis, and in-depth projections.
- Efficient and Precise: Avoid the hassle of building models from scratch while ensuring accuracy and adaptability.
Core Features
- Genuine Wuxi NCE Data: Obtain reliable pre-loaded historical data and prospective forecasts.
- Flexible Forecast Variables: Modify highlighted fields like WACC, growth rates, and profit margins.
- Real-Time Calculations: Automatic adjustments for DCF, Net Present Value (NPV), and cash flow assessments.
- Interactive Dashboard: User-friendly charts and summaries to help visualize your valuation outcomes.
- Suitable for All Levels: An intuitive framework designed for investors, CFOs, and consultants alike.
How It Works
- Step 1: Download the prebuilt Excel template featuring data on Wuxi NCE Power Co., Ltd. (605111SS).
- Step 2: Review the pre-filled sheets to familiarize yourself with the key metrics.
- Step 3: Modify forecasts and assumptions in the editable yellow cells (WACC, growth, margins).
- Step 4: Instantly see recalculated results, including the intrinsic value of Wuxi NCE Power Co., Ltd. (605111SS).
- Step 5: Utilize the outputs to make informed investment decisions or create detailed reports.
Why Choose Wuxi NCE Power Co., Ltd. (605111SS)?
- Time Efficiency: Skip building a financial model from the ground up – our solutions are ready to go.
- Enhanced Accuracy: Dependable data and formulas ensure precise valuations with minimal errors.
- Complete Customization: Adapt the model to suit your unique assumptions and forecasts.
- User-Friendly: Intuitive charts and outputs simplify the analysis of results.
- Endorsed by Professionals: Created for industry experts who prioritize accuracy and functionality.
Who Can Benefit from This Product?
- Finance Students: Master valuation methods and practice using real-world data.
- Academics: Integrate expert models into your teaching or research projects.
- Investors: Validate your hypotheses and evaluate valuation scenarios for Wuxi NCE Power Co., Ltd. (605111SS).
- Analysts: Enhance your efficiency with a customizable and ready-to-use DCF model.
- Small Business Owners: Understand the analytical approaches used for large public firms like Wuxi NCE Power Co., Ltd. (605111SS).
Contents of the Template
- Pre-Filled Data: Contains historical financial data and forecasts for Wuxi NCE Power Co., Ltd. (605111SS).
- Discounted Cash Flow Model: An editable DCF valuation model with automatic calculation features.
- Weighted Average Cost of Capital (WACC): A specialized sheet designed to calculate WACC using customized inputs.
- Key Financial Ratios: Evaluate Wuxi NCE Power Co., Ltd.'s profitability, efficiency, and leverage.
- Customizable Inputs: Easily modify assumptions for revenue growth, margins, and tax rates.
- Intuitive Dashboard: Visual displays and tables summarizing essential valuation outcomes.
Disclaimer
All information, articles, and product details provided on this website are for general informational and educational purposes only. We do not claim any ownership over, nor do we intend to infringe upon, any trademarks, copyrights, logos, brand names, or other intellectual property mentioned or depicted on this site. Such intellectual property remains the property of its respective owners, and any references here are made solely for identification or informational purposes, without implying any affiliation, endorsement, or partnership.
We make no representations or warranties, express or implied, regarding the accuracy, completeness, or suitability of any content or products presented. Nothing on this website should be construed as legal, tax, investment, financial, medical, or other professional advice. In addition, no part of this site—including articles or product references—constitutes a solicitation, recommendation, endorsement, advertisement, or offer to buy or sell any securities, franchises, or other financial instruments, particularly in jurisdictions where such activity would be unlawful.
All content is of a general nature and may not address the specific circumstances of any individual or entity. It is not a substitute for professional advice or services. Any actions you take based on the information provided here are strictly at your own risk. You accept full responsibility for any decisions or outcomes arising from your use of this website and agree to release us from any liability in connection with your use of, or reliance upon, the content or products found herein.