
|
Xiamen Leading Optics Co., Ltd. (605118.SS) Évaluation DCF |
Entièrement Modifiable: Adapté À Vos Besoins Dans Excel Ou Sheets
Conception Professionnelle: Modèles Fiables Et Conformes Aux Normes Du Secteur
Pré-Construits Pour Une Utilisation Rapide Et Efficace
Compatible MAC/PC, entièrement débloqué
Aucune Expertise N'Est Requise; Facile À Suivre
Xiamen Leading Optics Co., Ltd. (605118.SS) Bundle
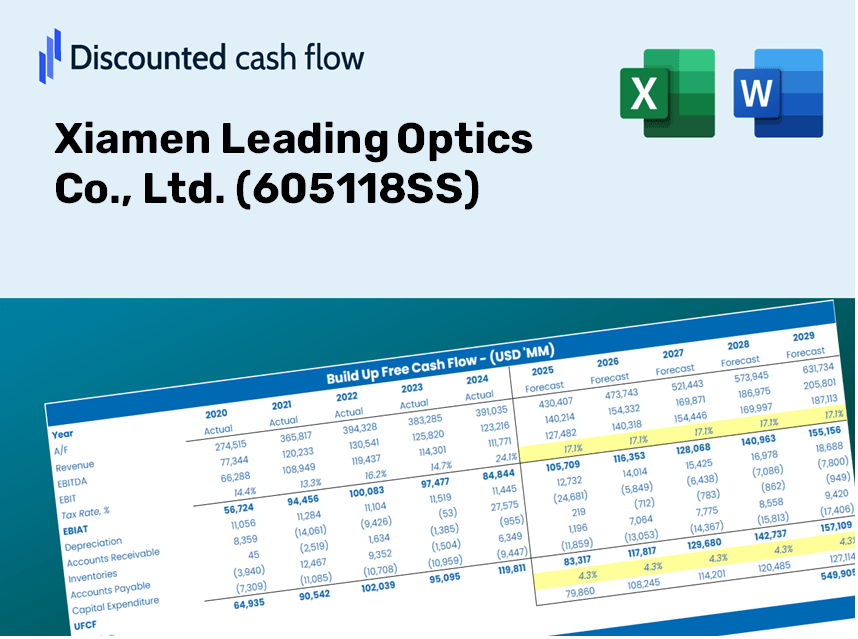
Simplifiez Xiamen Leading Optics Co., Ltd. (605118SS) Évaluation avec cette calculatrice DCF personnalisable! Doté de Real Xiamen Leading Optics Co., Ltd. (605118SS) Financials and Adjustable Prévisions, vous pouvez tester les scénarios et découvrir la juste valeur de Xiamen Leading Optics Co., Ltd. (605118SS).
Discounted Cash Flow (DCF) - (USD MM)
| Year | AY1 2020 |
AY2 2021 |
AY3 2022 |
AY4 2023 |
AY5 2024 |
FY1 2025 |
FY2 2026 |
FY3 2027 |
FY4 2028 |
FY5 2029 |
|---|---|---|---|---|---|---|---|---|---|---|
| Revenue | 417.1 | 501.0 | 585.1 | 604.0 | 620.5 | 687.0 | 760.6 | 842.1 | 932.4 | 1,032.4 |
| Revenue Growth, % | 0 | 20.14 | 16.78 | 3.23 | 2.73 | 10.72 | 10.72 | 10.72 | 10.72 | 10.72 |
| EBITDA | 174.3 | 162.0 | 163.2 | 182.6 | 189.5 | 223.7 | 247.7 | 274.2 | 303.6 | 336.1 |
| EBITDA, % | 41.79 | 32.34 | 27.9 | 30.23 | 30.54 | 32.56 | 32.56 | 32.56 | 32.56 | 32.56 |
| Depreciation | 22.3 | 24.2 | 33.6 | 41.0 | 45.9 | 41.4 | 45.8 | 50.7 | 56.1 | 62.1 |
| Depreciation, % | 5.35 | 4.83 | 5.74 | 6.78 | 7.4 | 6.02 | 6.02 | 6.02 | 6.02 | 6.02 |
| EBIT | 152.0 | 137.8 | 129.6 | 141.6 | 143.6 | 182.3 | 201.9 | 223.5 | 247.5 | 274.0 |
| EBIT, % | 36.44 | 27.51 | 22.16 | 23.45 | 23.14 | 26.54 | 26.54 | 26.54 | 26.54 | 26.54 |
| Total Cash | 653.2 | 467.6 | 565.3 | 584.2 | 606.4 | 665.5 | 736.9 | 815.9 | 903.3 | 1,000.1 |
| Total Cash, percent | .0 | .0 | .0 | .0 | .0 | .0 | .0 | .0 | .0 | .0 |
| Account Receivables | 69.0 | 81.6 | 87.6 | 83.0 | 103.6 | 107.5 | 119.0 | 131.8 | 145.9 | 161.5 |
| Account Receivables, % | 16.54 | 16.29 | 14.97 | 13.74 | 16.7 | 15.65 | 15.65 | 15.65 | 15.65 | 15.65 |
| Inventories | 122.0 | 260.0 | 274.2 | 190.9 | 176.5 | 258.4 | 286.1 | 316.7 | 350.7 | 388.3 |
| Inventories, % | 29.26 | 51.89 | 46.85 | 31.6 | 28.44 | 37.61 | 37.61 | 37.61 | 37.61 | 37.61 |
| Accounts Payable | 70.6 | 124.2 | 87.5 | 92.4 | 102.4 | 121.6 | 134.6 | 149.0 | 165.0 | 182.7 |
| Accounts Payable, % | 16.93 | 24.79 | 14.95 | 15.3 | 16.5 | 17.69 | 17.69 | 17.69 | 17.69 | 17.69 |
| Capital Expenditure | -44.1 | -177.2 | -125.7 | -64.4 | -58.9 | -120.3 | -133.2 | -147.5 | -163.3 | -180.9 |
| Capital Expenditure, % | -10.58 | -35.38 | -21.48 | -10.67 | -9.49 | -17.52 | -17.52 | -17.52 | -17.52 | -17.52 |
| Tax Rate, % | 12.5 | 12.5 | 12.5 | 12.5 | 12.5 | 12.5 | 12.5 | 12.5 | 12.5 | 12.5 |
| EBITAT | 132.6 | 122.0 | 115.7 | 125.0 | 125.6 | 160.7 | 178.0 | 197.0 | 218.2 | 241.5 |
| Depreciation | ||||||||||
| Changes in Account Receivables | ||||||||||
| Changes in Inventories | ||||||||||
| Changes in Accounts Payable | ||||||||||
| Capital Expenditure | ||||||||||
| UFCF | -9.6 | -128.1 | -33.3 | 194.4 | 116.5 | 15.1 | 64.3 | 71.2 | 78.8 | 87.3 |
| WACC, % | 6.17 | 6.17 | 6.17 | 6.17 | 6.17 | 6.17 | 6.17 | 6.17 | 6.17 | 6.17 |
| PV UFCF | ||||||||||
| SUM PV UFCF | 257.6 | |||||||||
| Long Term Growth Rate, % | 4.00 | |||||||||
| Free cash flow (T + 1) | 91 | |||||||||
| Terminal Value | 4,192 | |||||||||
| Present Terminal Value | 3,108 | |||||||||
| Enterprise Value | 3,366 | |||||||||
| Net Debt | -464 | |||||||||
| Equity Value | 3,830 | |||||||||
| Diluted Shares Outstanding, MM | 407 | |||||||||
| Equity Value Per Share | 9.41 |
What You Will Receive
- Authentic Xiamen Leading Optics Data: Preloaded financial metrics – encompassing revenue to EBIT – derived from both actual and projected figures.
- Comprehensive Customization: Modify all essential parameters (highlighted in yellow) such as WACC, growth %, and tax rates.
- Instantaneous Valuation Updates: Automatic recalculations to evaluate how adjustments affect the fair value of Xiamen Leading Optics (605118SS).
- Flexible Excel Template: Designed for quick revisions, scenario analysis, and in-depth forecasting.
- Efficiency and Precision: Avoid the hassle of constructing models from scratch while ensuring accuracy and adaptability.
Key Features
- Comprehensive Historical Data: Xiamen Leading Optics Co., Ltd.’s past financial statements and pre-populated forecasts.
- Flexible Input Options: Modify WACC, tax rates, revenue growth, and EBITDA margins as needed.
- Real-Time Calculations: Witness the intrinsic value of Xiamen Leading Optics Co., Ltd. update instantly.
- Intuitive Visual Representations: Dashboard graphs showcase valuation outcomes and essential metrics.
- Designed for Precision: A specialized tool tailored for analysts, investors, and finance professionals.
How It Functions
- 1. Access the Template: Download and open the Excel file containing Xiamen Leading Optics Co., Ltd. (605118SS) preloaded data.
- 2. Modify Assumptions: Adjust key parameters such as growth rates, WACC, and capital expenditures.
- 3. Review Results Instantly: The DCF model automatically computes intrinsic value and NPV.
- 4. Explore Scenarios: Evaluate various forecasts to assess different valuation results.
- 5. Utilize with Assurance: Present polished valuation insights to inform your decision-making process.
Why Opt for Xiamen Leading Optics Co., Ltd.?
- Precision: Utilizes authentic Xiamen Leading Optics financial data for reliable outcomes.
- Adaptability: Tailored for users to freely explore and adjust inputs.
- Efficiency: Eliminate the complexity of creating financial models from the ground up.
- High-Quality Standards: Crafted with the expertise and functionality expected at the CFO level.
- Intuitive Design: Simple to navigate, suitable for individuals with varying levels of financial background.
Who Can Benefit from This Product?
- Investment Professionals: Develop comprehensive and accurate valuation models for portfolio assessments related to Xiamen Leading Optics Co., Ltd. (605118SS).
- Corporate Finance Departments: Evaluate valuation scenarios to inform strategic decisions within the company.
- Consultants and Financial Advisors: Deliver precise valuation insights for clients interested in Xiamen Leading Optics Co., Ltd. (605118SS).
- Students and Educators: Utilize real-time data to learn and teach financial modeling techniques.
- Optics Industry Enthusiasts: Gain insights into how optics companies like Xiamen Leading Optics Co., Ltd. (605118SS) are valued in the marketplace.
Contents of the Template
- Pre-Filled DCF Model: Xiamen Leading Optics Co., Ltd.'s financial data preloaded for immediate use.
- WACC Calculator: Comprehensive calculations for Weighted Average Cost of Capital.
- Financial Ratios: Assess Xiamen Leading Optics Co., Ltd.'s profitability, leverage, and efficiency.
- Editable Inputs: Modify assumptions such as growth rates, margins, and capital expenditures to suit your scenarios.
- Financial Statements: Access annual and quarterly reports to facilitate detailed analysis.
- Interactive Dashboard: Seamlessly visualize key valuation metrics and outcomes.
Disclaimer
All information, articles, and product details provided on this website are for general informational and educational purposes only. We do not claim any ownership over, nor do we intend to infringe upon, any trademarks, copyrights, logos, brand names, or other intellectual property mentioned or depicted on this site. Such intellectual property remains the property of its respective owners, and any references here are made solely for identification or informational purposes, without implying any affiliation, endorsement, or partnership.
We make no representations or warranties, express or implied, regarding the accuracy, completeness, or suitability of any content or products presented. Nothing on this website should be construed as legal, tax, investment, financial, medical, or other professional advice. In addition, no part of this site—including articles or product references—constitutes a solicitation, recommendation, endorsement, advertisement, or offer to buy or sell any securities, franchises, or other financial instruments, particularly in jurisdictions where such activity would be unlawful.
All content is of a general nature and may not address the specific circumstances of any individual or entity. It is not a substitute for professional advice or services. Any actions you take based on the information provided here are strictly at your own risk. You accept full responsibility for any decisions or outcomes arising from your use of this website and agree to release us from any liability in connection with your use of, or reliance upon, the content or products found herein.