
|
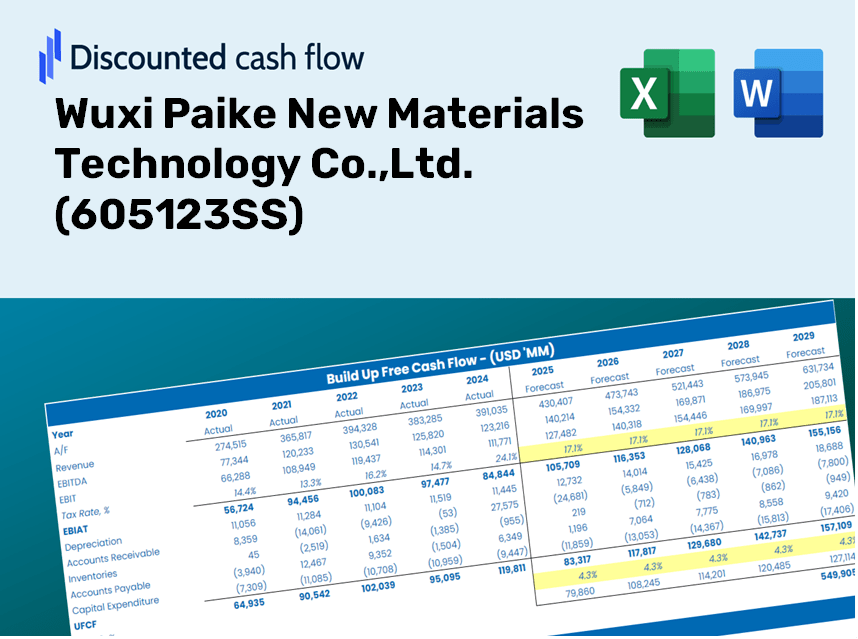
Wuxi Paike New Materials Technology Co., Ltd. (605123.SS) Évaluation DCF |
Entièrement Modifiable: Adapté À Vos Besoins Dans Excel Ou Sheets
Conception Professionnelle: Modèles Fiables Et Conformes Aux Normes Du Secteur
Pré-Construits Pour Une Utilisation Rapide Et Efficace
Compatible MAC/PC, entièrement débloqué
Aucune Expertise N'Est Requise; Facile À Suivre
Wuxi Paike New Materials Technology Co.,Ltd. (605123.SS) Bundle
Découvrez le véritable potentiel de Wuxi Paike New Materials Technology Co., Ltd. (605123SS) avec notre calculatrice avancée DCF! Ajustez les hypothèses clés, explorez divers scénarios et évaluez comment les changements affectent l'évaluation de Wuxi Paike New Materials Technology Co., Ltd. (605123SS) - le tout dans un seul modèle Excel.
Discounted Cash Flow (DCF) - (USD MM)
| Year | AY1 2020 |
AY2 2021 |
AY3 2022 |
AY4 2023 |
AY5 2024 |
FY1 2025 |
FY2 2026 |
FY3 2027 |
FY4 2028 |
FY5 2029 |
|---|---|---|---|---|---|---|---|---|---|---|
| Revenue | 1,027.8 | 1,733.3 | 2,782.0 | 3,618.3 | 3,212.7 | 4,401.4 | 6,030.0 | 8,261.1 | 11,317.7 | 15,505.3 |
| Revenue Growth, % | 0 | 68.65 | 60.5 | 30.06 | -11.21 | 37 | 37 | 37 | 37 | 37 |
| EBITDA | 211.8 | 377.7 | 555.3 | 601.4 | 392.0 | 802.6 | 1,099.6 | 1,506.5 | 2,063.9 | 2,827.5 |
| EBITDA, % | 20.61 | 21.79 | 19.96 | 16.62 | 12.2 | 18.24 | 18.24 | 18.24 | 18.24 | 18.24 |
| Depreciation | 24.8 | 44.2 | 67.0 | 113.3 | 133.9 | 129.1 | 176.9 | 242.4 | 332.1 | 455.0 |
| Depreciation, % | 2.41 | 2.55 | 2.41 | 3.13 | 4.17 | 2.93 | 2.93 | 2.93 | 2.93 | 2.93 |
| EBIT | 187.0 | 333.5 | 488.2 | 488.1 | 258.1 | 673.5 | 922.7 | 1,264.1 | 1,731.8 | 2,372.6 |
| EBIT, % | 18.2 | 19.24 | 17.55 | 13.49 | 8.03 | 15.3 | 15.3 | 15.3 | 15.3 | 15.3 |
| Total Cash | 305.0 | 546.6 | 1,837.9 | 1,982.1 | 1,977.9 | 2,144.6 | 2,938.1 | 4,025.2 | 5,514.5 | 7,554.9 |
| Total Cash, percent | .0 | .0 | .0 | .0 | .0 | .0 | .0 | .0 | .0 | .0 |
| Account Receivables | 727.3 | 1,111.1 | 1,404.2 | 2,109.2 | 2,097.6 | 2,719.4 | 3,725.6 | 5,104.0 | 6,992.6 | 9,579.8 |
| Account Receivables, % | 70.76 | 64.1 | 50.48 | 58.29 | 65.29 | 61.78 | 61.78 | 61.78 | 61.78 | 61.78 |
| Inventories | 281.9 | 499.1 | 897.8 | 913.4 | 1,077.7 | 1,296.5 | 1,776.3 | 2,433.5 | 3,333.9 | 4,567.4 |
| Inventories, % | 27.43 | 28.79 | 32.27 | 25.24 | 33.54 | 29.46 | 29.46 | 29.46 | 29.46 | 29.46 |
| Accounts Payable | 543.4 | 900.5 | 401.2 | 1,530.1 | 1,696.1 | 1,886.6 | 2,584.7 | 3,541.1 | 4,851.3 | 6,646.2 |
| Accounts Payable, % | 52.87 | 51.95 | 14.42 | 42.29 | 52.79 | 42.86 | 42.86 | 42.86 | 42.86 | 42.86 |
| Capital Expenditure | -155.3 | -179.5 | -403.3 | -239.4 | -594.4 | -572.9 | -784.9 | -1,075.3 | -1,473.1 | -2,018.2 |
| Capital Expenditure, % | -15.11 | -10.35 | -14.5 | -6.62 | -18.5 | -13.02 | -13.02 | -13.02 | -13.02 | -13.02 |
| Tax Rate, % | 11.11 | 11.11 | 11.11 | 11.11 | 11.11 | 11.11 | 11.11 | 11.11 | 11.11 | 11.11 |
| EBITAT | 153.3 | 291.4 | 464.5 | 432.6 | 229.4 | 595.4 | 815.7 | 1,117.5 | 1,531.0 | 2,097.5 |
| Depreciation | ||||||||||
| Changes in Account Receivables | ||||||||||
| Changes in Inventories | ||||||||||
| Changes in Accounts Payable | ||||||||||
| Capital Expenditure | ||||||||||
| UFCF | -443.0 | -87.8 | -1,062.8 | 715.0 | -217.8 | -498.5 | -580.1 | -794.7 | -1,088.7 | -1,491.6 |
| WACC, % | 4.6 | 4.61 | 4.63 | 4.61 | 4.61 | 4.61 | 4.61 | 4.61 | 4.61 | 4.61 |
| PV UFCF | ||||||||||
| SUM PV UFCF | -3,800.1 | |||||||||
| Long Term Growth Rate, % | 3.50 | |||||||||
| Free cash flow (T + 1) | -1,544 | |||||||||
| Terminal Value | -138,675 | |||||||||
| Present Terminal Value | -110,679 | |||||||||
| Enterprise Value | -114,479 | |||||||||
| Net Debt | -825 | |||||||||
| Equity Value | -113,654 | |||||||||
| Diluted Shares Outstanding, MM | 121 | |||||||||
| Equity Value Per Share | -937.96 |
What You Will Gain
- Adjustable Forecast Parameters: Effortlessly modify assumptions (growth %, margins, WACC) to explore various scenarios.
- Industry-Specific Data: Wuxi Paike’s financial metrics pre-loaded to enhance your analysis.
- Instant DCF Calculations: The model computes Net Present Value (NPV) and intrinsic value automatically.
- Tailored and Professional Design: A sleek Excel template that meets your valuation demands.
- Designed for Analysts and Investors: Perfect for evaluating projections, verifying strategies, and optimizing efficiency.
Highlighted Features
- Customizable Forecast Inputs: Adjust essential parameters such as revenue growth, EBITDA percentage, and capital expenditures.
- Instant DCF Valuation: Automatically computes intrinsic value, net present value (NPV), and other key metrics.
- High-Precision Accuracy: Leverages Wuxi Paike's actual financial data to ensure realistic valuation results.
- Simplified Scenario Analysis: Effortlessly evaluate various assumptions and compare results.
- Efficiency Booster: Avoid the complexities of building detailed valuation models from the ground up.
How It Works
- Step 1: Download the ready-to-use Excel template featuring Wuxi Paike New Materials Technology Co., Ltd. (605123SS) data.
- Step 2: Review the pre-filled sheets to grasp the essential metrics.
- Step 3: Modify forecasts and assumptions in the editable yellow cells (WACC, growth, margins).
- Step 4: Instantly access updated results, including Wuxi Paike's intrinsic value.
- Step 5: Make well-informed investment choices or produce reports based on the outputs.
Why Opt for Wuxi Paike New Materials Technology Co., Ltd. (605123SS)?
- Precision: Real-time data from Wuxi Paike ensures reliable and accurate results.
- Versatility: Tailored for users to freely adjust and experiment with different parameters.
- Efficiency: Eliminate the need to create models from the ground up.
- Expert-Level: Crafted with the expertise and standards expected at the CFO level.
- Intuitive: Designed for ease of use, catering to users at all experience levels in financial analysis.
Who Can Benefit from This Product?
- Investors: Evaluate Wuxi Paike's valuation before making stock trades for (605123SS).
- CFOs and Financial Analysts: Optimize valuation processes and validate financial forecasts for (605123SS).
- Startup Founders: Gain insights into how established firms like Wuxi Paike are valued in the market.
- Consultants: Create detailed valuation reports tailored for clients focusing on (605123SS).
- Students and Educators: Utilize real market data to practice and teach valuation methodologies related to (605123SS).
What the Template Contains
- Historical Data: Includes Wuxi Paike New Materials Technology Co., Ltd.'s past financials and baseline forecasts.
- DCF and Levered DCF Models: Detailed templates to calculate Wuxi Paike's intrinsic value.
- WACC Sheet: Pre-built calculations for Weighted Average Cost of Capital.
- Editable Inputs: Modify key drivers like growth rates, EBITDA %, and CAPEX assumptions.
- Quarterly and Annual Statements: A complete breakdown of Wuxi Paike's financials.
- Interactive Dashboard: Visualize valuation results and projections dynamically.
Disclaimer
All information, articles, and product details provided on this website are for general informational and educational purposes only. We do not claim any ownership over, nor do we intend to infringe upon, any trademarks, copyrights, logos, brand names, or other intellectual property mentioned or depicted on this site. Such intellectual property remains the property of its respective owners, and any references here are made solely for identification or informational purposes, without implying any affiliation, endorsement, or partnership.
We make no representations or warranties, express or implied, regarding the accuracy, completeness, or suitability of any content or products presented. Nothing on this website should be construed as legal, tax, investment, financial, medical, or other professional advice. In addition, no part of this site—including articles or product references—constitutes a solicitation, recommendation, endorsement, advertisement, or offer to buy or sell any securities, franchises, or other financial instruments, particularly in jurisdictions where such activity would be unlawful.
All content is of a general nature and may not address the specific circumstances of any individual or entity. It is not a substitute for professional advice or services. Any actions you take based on the information provided here are strictly at your own risk. You accept full responsibility for any decisions or outcomes arising from your use of this website and agree to release us from any liability in connection with your use of, or reliance upon, the content or products found herein.