
|
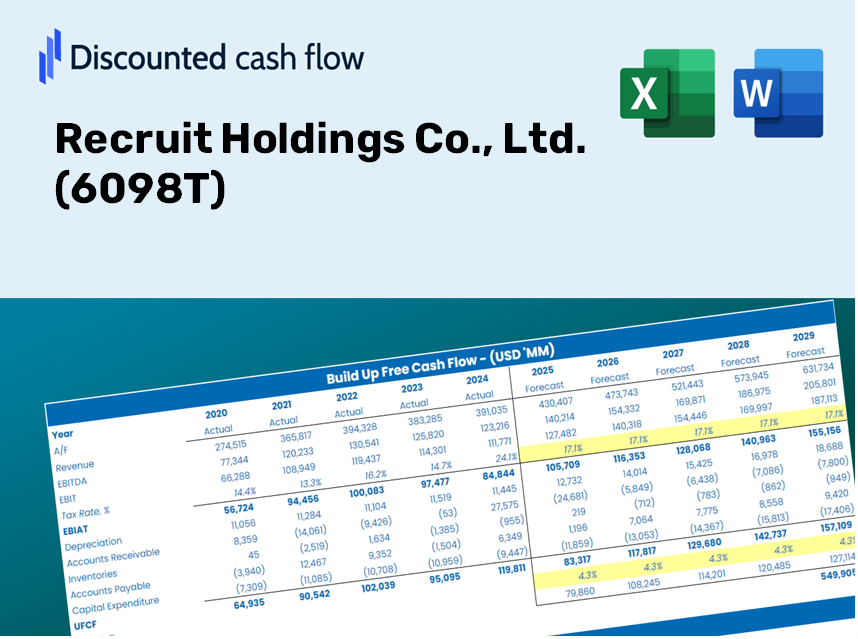
Recruit Holdings Co., Ltd. (6098.T) Évaluation DCF |
Entièrement Modifiable: Adapté À Vos Besoins Dans Excel Ou Sheets
Conception Professionnelle: Modèles Fiables Et Conformes Aux Normes Du Secteur
Pré-Construits Pour Une Utilisation Rapide Et Efficace
Compatible MAC/PC, entièrement débloqué
Aucune Expertise N'Est Requise; Facile À Suivre
Recruit Holdings Co., Ltd. (6098.T) Bundle
Améliorez vos stratégies d'investissement avec Recruit Holdings Co., Ltd. (6098T) Calculatrice DCF! Explorez les données financières réelles, ajustez les prévisions et les dépenses de croissance et observez comment ces modifications affectent instantanément la valeur intrinsèque des avoirs de recrue.
Discounted Cash Flow (DCF) - (USD MM)
| Year | AY1 2021 |
AY2 2022 |
AY3 2023 |
AY4 2024 |
AY5 2025 |
FY1 2026 |
FY2 2027 |
FY3 2028 |
FY4 2029 |
FY5 2030 |
|---|---|---|---|---|---|---|---|---|---|---|
| Revenue | 2,269,346.0 | 2,871,705.0 | 3,429,519.0 | 3,416,492.0 | 3,557,478.0 | 3,999,624.1 | 4,496,722.9 | 5,055,604.4 | 5,683,947.2 | 6,390,384.5 |
| Revenue Growth, % | 0 | 26.54 | 19.42 | -0.37985 | 4.13 | 12.43 | 12.43 | 12.43 | 12.43 | 12.43 |
| EBITDA | 285,968.0 | 504,897.0 | 491,734.0 | 575,939.0 | 655,818.0 | 638,451.4 | 717,802.3 | 807,015.3 | 907,316.3 | 1,020,083.4 |
| EBITDA, % | 12.6 | 17.58 | 14.34 | 16.86 | 18.43 | 15.96 | 15.96 | 15.96 | 15.96 | 15.96 |
| Depreciation | 119,991.0 | 123,169.0 | 122,044.0 | 117,481.0 | 109,237.0 | 157,140.7 | 176,671.1 | 198,629.0 | 223,315.8 | 251,071.0 |
| Depreciation, % | 5.29 | 4.29 | 3.56 | 3.44 | 3.07 | 3.93 | 3.93 | 3.93 | 3.93 | 3.93 |
| EBIT | 165,977.0 | 381,728.0 | 369,690.0 | 458,458.0 | 546,581.0 | 481,310.7 | 541,131.1 | 608,386.4 | 684,000.5 | 769,012.4 |
| EBIT, % | 7.31 | 13.29 | 10.78 | 13.42 | 15.36 | 12.03 | 12.03 | 12.03 | 12.03 | 12.03 |
| Total Cash | 540,086.0 | 671,454.0 | 883,999.0 | 1,136,858.0 | 808,625.0 | 1,031,606.8 | 1,159,821.5 | 1,303,971.5 | 1,466,037.5 | 1,648,246.0 |
| Total Cash, percent | .0 | .0 | .0 | .0 | .0 | .0 | .0 | .0 | .0 | .0 |
| Account Receivables | 342,259.0 | 422,380.0 | 454,711.0 | 454,379.0 | 565,069.0 | 577,805.4 | 649,618.8 | 730,357.5 | 821,131.0 | 923,186.4 |
| Account Receivables, % | 15.08 | 14.71 | 13.26 | 13.3 | 15.88 | 14.45 | 14.45 | 14.45 | 14.45 | 14.45 |
| Inventories | .0 | 45,652.0 | 72,847.0 | .0 | .0 | 29,707.9 | 33,400.2 | 37,551.4 | 42,218.5 | 47,465.7 |
| Inventories, % | 0 | 1.59 | 2.12 | 0 | 0 | 0.74277 | 0.74277 | 0.74277 | 0.74277 | 0.74277 |
| Accounts Payable | 57,413.0 | 29,269.0 | 4,040.0 | 76,544.0 | 377,543.0 | 132,147.9 | 148,572.1 | 167,037.6 | 187,798.1 | 211,138.8 |
| Accounts Payable, % | 2.53 | 1.02 | 0.1178 | 2.24 | 10.61 | 3.3 | 3.3 | 3.3 | 3.3 | 3.3 |
| Capital Expenditure | -58,314.0 | -64,385.0 | -76,756.0 | -69,929.0 | -7,951.0 | -74,553.7 | -83,819.8 | -94,237.4 | -105,949.8 | -119,118.0 |
| Capital Expenditure, % | -2.57 | -2.24 | -2.24 | -2.05 | -0.2235 | -1.86 | -1.86 | -1.86 | -1.86 | -1.86 |
| Tax Rate, % | 22.51 | 22.51 | 22.51 | 22.51 | 22.51 | 22.51 | 22.51 | 22.51 | 22.51 | 22.51 |
| EBITAT | 129,424.1 | 296,041.2 | 271,209.7 | 380,384.6 | 423,566.2 | 374,802.1 | 421,384.9 | 473,757.3 | 532,638.9 | 598,838.6 |
| Depreciation | ||||||||||
| Changes in Account Receivables | ||||||||||
| Changes in Inventories | ||||||||||
| Changes in Accounts Payable | ||||||||||
| Capital Expenditure | ||||||||||
| UFCF | -93,744.9 | 200,908.2 | 231,742.7 | 573,619.6 | 715,161.2 | 169,549.7 | 455,154.8 | 511,724.4 | 575,324.8 | 646,829.8 |
| WACC, % | 7.79 | 7.79 | 7.78 | 7.79 | 7.79 | 7.79 | 7.79 | 7.79 | 7.79 | 7.79 |
| PV UFCF | ||||||||||
| SUM PV UFCF | 1,828,576.9 | |||||||||
| Long Term Growth Rate, % | 3.00 | |||||||||
| Free cash flow (T + 1) | 666,235 | |||||||||
| Terminal Value | 13,920,276 | |||||||||
| Present Terminal Value | 9,568,296 | |||||||||
| Enterprise Value | 11,396,873 | |||||||||
| Net Debt | -599,685 | |||||||||
| Equity Value | 11,996,558 | |||||||||
| Diluted Shares Outstanding, MM | 1,522 | |||||||||
| Equity Value Per Share | 7,879.72 |
What You Will Gain
- Authentic Recruit Holdings Data: Preloaded financials – covering everything from revenue to EBIT – derived from both actual and forecasted figures.
- Comprehensive Customization: Modify all essential parameters (yellow cells) such as WACC, growth %, and tax rates to suit your analysis.
- Immediate Valuation Updates: Automatic recalculations that allow you to assess the effects of any changes on Recruit Holdings' fair value.
- Flexible Excel Template: Designed for quick adjustments, scenario analysis, and in-depth projections.
- Efficient and Precise: Eliminate the need to construct models from the ground up while ensuring accuracy and adaptability.
Key Features
- Accurate Recruit Financials: Gain access to precise pre-loaded historical data and future forecasts.
- Adjustable Forecast Parameters: Modify highlighted fields such as WACC, growth rates, and margins with ease.
- Real-Time Calculations: Automatic updates for DCF, Net Present Value (NPV), and cash flow assessments.
- Interactive Visual Dashboard: Intuitive charts and summaries to clearly present your valuation outcomes.
- Designed for All Skill Levels: A user-friendly layout tailored for investors, CFOs, and consultants alike.
How It Works
- Download: Obtain the pre-formatted Excel file containing Recruit Holdings Co., Ltd. (6098T) financial data.
- Customize: Modify projections such as revenue growth, EBITDA %, and WACC to fit your analysis.
- Update Automatically: Watch as intrinsic value and NPV calculations refresh in real-time.
- Test Scenarios: Generate various forecasts and instantly compare different outcomes.
- Make Decisions: Leverage the valuation insights to shape your investment approach.
Why Choose This Calculator for Recruit Holdings Co., Ltd. (6098T)?
- Precise Information: Authentic Recruit Holdings financial data guarantee trustworthy valuation outcomes.
- Tailorable: Modify essential inputs such as growth rates, WACC, and tax rates to align with your forecasts.
- Efficient: Ready-made calculations save you the effort of starting from scratch.
- Professional-Quality Tool: Crafted for investors, analysts, and consultants alike.
- Easy to Use: User-friendly layout and guided instructions simplify the process for everyone.
Who Can Benefit from This Product?
- Investors: Assess Recruit Holdings Co., Ltd.’s (6098T) valuation before making stock decisions.
- CFOs and Financial Analysts: Enhance valuation methodologies and validate financial forecasts.
- Startup Founders: Discover how large public firms like Recruit Holdings Co., Ltd. (6098T) are valued.
- Consultants: Create comprehensive valuation reports for your clients.
- Students and Educators: Utilize real market data to develop and teach valuation skills.
What the Template Includes
- Pre-Filled DCF Model: Recruit Holdings Co., Ltd. (6098T) financial data preloaded for immediate use.
- WACC Calculator: Comprehensive calculations for Weighted Average Cost of Capital.
- Financial Ratios: Assess Recruit Holdings Co., Ltd. (6098T) profitability, leverage, and efficiency.
- Editable Inputs: Modify assumptions such as growth rates, margins, and CAPEX to suit your scenarios.
- Financial Statements: Annual and quarterly reports provided for thorough analysis.
- Interactive Dashboard: Effortlessly visualize essential valuation metrics and outcomes.
Disclaimer
All information, articles, and product details provided on this website are for general informational and educational purposes only. We do not claim any ownership over, nor do we intend to infringe upon, any trademarks, copyrights, logos, brand names, or other intellectual property mentioned or depicted on this site. Such intellectual property remains the property of its respective owners, and any references here are made solely for identification or informational purposes, without implying any affiliation, endorsement, or partnership.
We make no representations or warranties, express or implied, regarding the accuracy, completeness, or suitability of any content or products presented. Nothing on this website should be construed as legal, tax, investment, financial, medical, or other professional advice. In addition, no part of this site—including articles or product references—constitutes a solicitation, recommendation, endorsement, advertisement, or offer to buy or sell any securities, franchises, or other financial instruments, particularly in jurisdictions where such activity would be unlawful.
All content is of a general nature and may not address the specific circumstances of any individual or entity. It is not a substitute for professional advice or services. Any actions you take based on the information provided here are strictly at your own risk. You accept full responsibility for any decisions or outcomes arising from your use of this website and agree to release us from any liability in connection with your use of, or reliance upon, the content or products found herein.