
|
Topsports International Holdings Limited (6110.hk) Valation DCF |
Entièrement Modifiable: Adapté À Vos Besoins Dans Excel Ou Sheets
Conception Professionnelle: Modèles Fiables Et Conformes Aux Normes Du Secteur
Pré-Construits Pour Une Utilisation Rapide Et Efficace
Compatible MAC/PC, entièrement débloqué
Aucune Expertise N'Est Requise; Facile À Suivre
Topsports International Holdings Limited (6110.HK) Bundle
En tant qu'investisseur ou analyste, cette calculatrice DCF (6110HK) est votre outil incontournable pour une évaluation précise. Avec de vraies données de TopSports International Holdings Limited, vous pouvez ajuster les prévisions et observer les effets en temps réel.
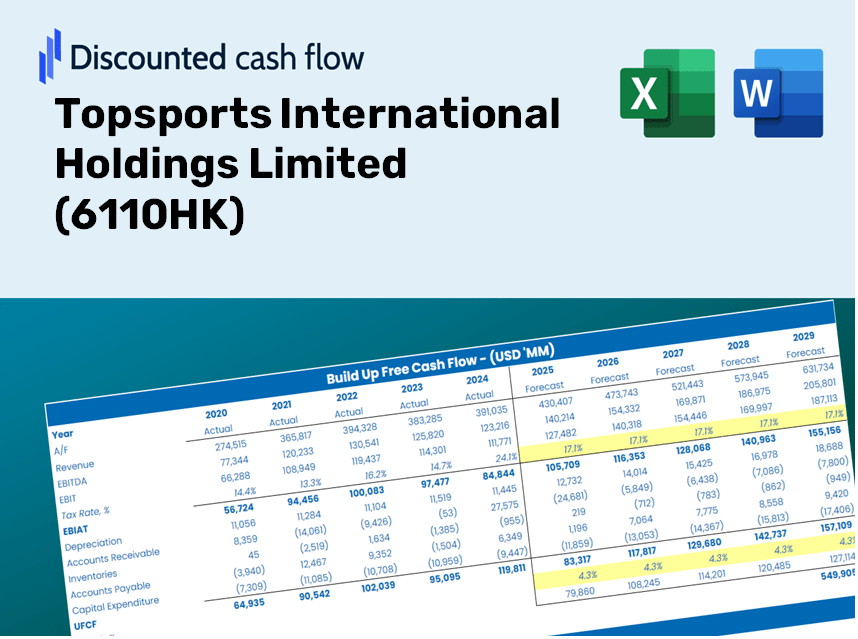
Discounted Cash Flow (DCF) - (USD MM)
| Year | AY1 2020 |
AY2 2021 |
AY3 2022 |
AY4 2023 |
AY5 2024 |
FY1 2025 |
FY2 2026 |
FY3 2027 |
FY4 2028 |
FY5 2029 |
|---|---|---|---|---|---|---|---|---|---|---|
| Revenue | 39,342.9 | 34,827.8 | 29,579.8 | 31,612.0 | 29,513.9 | 27,572.5 | 25,758.8 | 24,064.4 | 22,481.5 | 21,002.7 |
| Revenue Growth, % | 0 | -11.48 | -15.07 | 6.87 | -6.64 | -6.58 | -6.58 | -6.58 | -6.58 | -6.58 |
| EBITDA | 5,149.0 | 4,552.8 | 3,433.8 | 5,002.2 | 3,428.2 | 3,595.9 | 3,359.3 | 3,138.4 | 2,931.9 | 2,739.1 |
| EBITDA, % | 13.09 | 13.07 | 11.61 | 15.82 | 11.62 | 13.04 | 13.04 | 13.04 | 13.04 | 13.04 |
| Depreciation | 2,875.7 | 2,762.2 | 2,420.8 | 1,826.6 | 1,595.6 | 1,908.5 | 1,783.0 | 1,665.7 | 1,556.1 | 1,453.8 |
| Depreciation, % | 7.31 | 7.93 | 8.18 | 5.78 | 5.41 | 6.92 | 6.92 | 6.92 | 6.92 | 6.92 |
| EBIT | 2,273.3 | 1,790.6 | 1,012.9 | 3,175.6 | 1,832.6 | 1,687.4 | 1,576.4 | 1,472.7 | 1,375.8 | 1,285.3 |
| EBIT, % | 5.78 | 5.14 | 3.42 | 10.05 | 6.21 | 6.12 | 6.12 | 6.12 | 6.12 | 6.12 |
| Total Cash | 1,342.6 | 1,914.9 | 2,597.5 | 2,137.1 | 2,827.0 | 1,876.6 | 1,753.2 | 1,637.9 | 1,530.1 | 1,429.5 |
| Total Cash, percent | .0 | .0 | .0 | .0 | .0 | .0 | .0 | .0 | .0 | .0 |
| Account Receivables | 2,378.9 | 1,209.4 | 1,152.6 | 1,731.6 | 999.9 | 1,228.7 | 1,147.9 | 1,072.4 | 1,001.8 | 935.9 |
| Account Receivables, % | 6.05 | 3.47 | 3.9 | 5.48 | 3.39 | 4.46 | 4.46 | 4.46 | 4.46 | 4.46 |
| Inventories | 6,786.4 | 7,305.2 | 6,825.7 | 6,865.6 | 6,559.9 | 5,803.7 | 5,422.0 | 5,065.3 | 4,732.1 | 4,420.9 |
| Inventories, % | 17.25 | 20.98 | 23.08 | 21.72 | 22.23 | 21.05 | 21.05 | 21.05 | 21.05 | 21.05 |
| Accounts Payable | 486.6 | 1,012.5 | 1,082.8 | 422.9 | 375.2 | 574.3 | 536.5 | 501.2 | 468.2 | 437.4 |
| Accounts Payable, % | 1.24 | 2.91 | 3.66 | 1.34 | 1.27 | 2.08 | 2.08 | 2.08 | 2.08 | 2.08 |
| Capital Expenditure | -702.6 | -782.7 | -390.1 | -433.6 | -407.3 | -446.9 | -417.5 | -390.0 | -364.4 | -340.4 |
| Capital Expenditure, % | -1.79 | -2.25 | -1.32 | -1.37 | -1.38 | -1.62 | -1.62 | -1.62 | -1.62 | -1.62 |
| Tax Rate, % | 17.54 | 17.54 | 17.54 | 17.54 | 17.54 | 17.54 | 17.54 | 17.54 | 17.54 | 17.54 |
| EBITAT | 1,635.3 | 1,317.1 | 801.1 | 2,547.0 | 1,511.1 | 1,306.8 | 1,220.9 | 1,140.6 | 1,065.5 | 995.4 |
| Depreciation | ||||||||||
| Changes in Account Receivables | ||||||||||
| Changes in Inventories | ||||||||||
| Changes in Accounts Payable | ||||||||||
| Capital Expenditure | ||||||||||
| UFCF | -4,870.2 | 4,473.0 | 3,438.4 | 2,661.1 | 3,689.1 | 3,494.9 | 3,011.1 | 2,813.1 | 2,628.0 | 2,455.2 |
| WACC, % | 4.98 | 4.99 | 5.03 | 5.03 | 5.05 | 5.02 | 5.02 | 5.02 | 5.02 | 5.02 |
| PV UFCF | ||||||||||
| SUM PV UFCF | 12,570.5 | |||||||||
| Long Term Growth Rate, % | 3.00 | |||||||||
| Free cash flow (T + 1) | 2,529 | |||||||||
| Terminal Value | 125,498 | |||||||||
| Present Terminal Value | 98,261 | |||||||||
| Enterprise Value | 110,831 | |||||||||
| Net Debt | 1,614 | |||||||||
| Equity Value | 109,217 | |||||||||
| Diluted Shares Outstanding, MM | 6,201 | |||||||||
| Equity Value Per Share | 17.61 |
Benefits You Will Receive
- Accurate 6110HK Financials: Comprehensive historical and projected data for precise valuation.
- Customizable Inputs: Adjust parameters such as WACC, tax rates, revenue growth, and capital expenditures.
- Real-Time Calculations: Dynamic computation of intrinsic value and NPV.
- Scenario Analysis: Explore various scenarios to assess Topsports’ future growth.
- User-Friendly Design: Designed for professionals but easy to navigate for newcomers.
Key Features
- Customizable Forecast Inputs: Adjust essential parameters such as revenue growth, EBITDA percentage, and capital expenditures to fit your analysis.
- Instant DCF Valuation: Automatically computes intrinsic value, NPV, and other key metrics in real-time.
- High-Precision Accuracy: Utilizes Topsports International Holdings Limited’s (6110HK) actual financial data to deliver reliable valuation results.
- Simplified Scenario Analysis: Effortlessly evaluate various assumptions and contrast results for informed decision-making.
- Efficiency Booster: Streamline your workflow by eliminating the need to construct intricate valuation models from the ground up.
How It Functions
- Download: Obtain the pre-configured Excel file containing Topsports International Holdings Limited’s (6110HK) financial information.
- Customize: Modify projections such as revenue growth, EBITDA percentage, and WACC to suit your analysis.
- Update Automatically: Watch as intrinsic value and NPV computations refresh in real-time.
- Test Scenarios: Generate various forecasts and instantly analyze their implications.
- Make Decisions: Leverage the valuation insights to inform your investment choices.
Why Opt for This Calculator?
- All-in-One Solution: Features DCF, WACC, and comprehensive financial ratio analyses together.
- Flexible Inputs: Modify the highlighted fields to explore different financial scenarios.
- In-Depth Analysis: Automatically computes the intrinsic value and Net Present Value for Topsports International Holdings Limited (6110HK).
- Integrated Data: Includes historical and projected data for precise calculations.
- High-Caliber Tool: Perfectly suited for financial analysts, investors, and business advisors.
Who Can Benefit from This Product?
- Institutional Investors: Develop comprehensive and accurate valuation models for portfolio assessment related to Topsports International Holdings Limited (6110HK).
- Finance Departments: Evaluate various valuation scenarios to inform corporate strategy for Topsports International Holdings Limited (6110HK).
- Advisors and Consultants: Equip clients with precise valuation analyses of Topsports International Holdings Limited (6110HK) stock.
- Academic Professionals and Students: Utilize real-time market data to enhance learning and practice in financial modeling concerning Topsports International Holdings Limited (6110HK).
- Sports and Retail Analysts: Gain insights into how sports retail companies like Topsports International Holdings Limited (6110HK) are appraised in the market.
Contents of the Template
- Pre-Filled DCF Model: Topsports International Holdings Limited’s (6110HK) financial data ready for immediate analysis.
- WACC Calculator: Comprehensive calculations for the Weighted Average Cost of Capital.
- Financial Ratios: Assess Topsports’ profitability, leverage, and operational efficiency.
- Editable Inputs: Modify assumptions regarding growth, profit margins, and capital expenditures to suit your scenarios.
- Financial Statements: Access annual and quarterly reports for thorough analysis.
- Interactive Dashboard: Effortlessly visualize essential valuation metrics and outcomes.
Disclaimer
All information, articles, and product details provided on this website are for general informational and educational purposes only. We do not claim any ownership over, nor do we intend to infringe upon, any trademarks, copyrights, logos, brand names, or other intellectual property mentioned or depicted on this site. Such intellectual property remains the property of its respective owners, and any references here are made solely for identification or informational purposes, without implying any affiliation, endorsement, or partnership.
We make no representations or warranties, express or implied, regarding the accuracy, completeness, or suitability of any content or products presented. Nothing on this website should be construed as legal, tax, investment, financial, medical, or other professional advice. In addition, no part of this site—including articles or product references—constitutes a solicitation, recommendation, endorsement, advertisement, or offer to buy or sell any securities, franchises, or other financial instruments, particularly in jurisdictions where such activity would be unlawful.
All content is of a general nature and may not address the specific circumstances of any individual or entity. It is not a substitute for professional advice or services. Any actions you take based on the information provided here are strictly at your own risk. You accept full responsibility for any decisions or outcomes arising from your use of this website and agree to release us from any liability in connection with your use of, or reliance upon, the content or products found herein.