
|
Disco Corporation (6146.T) Évaluation DCF |
Entièrement Modifiable: Adapté À Vos Besoins Dans Excel Ou Sheets
Conception Professionnelle: Modèles Fiables Et Conformes Aux Normes Du Secteur
Pré-Construits Pour Une Utilisation Rapide Et Efficace
Compatible MAC/PC, entièrement débloqué
Aucune Expertise N'Est Requise; Facile À Suivre
Disco Corporation (6146.T) Bundle
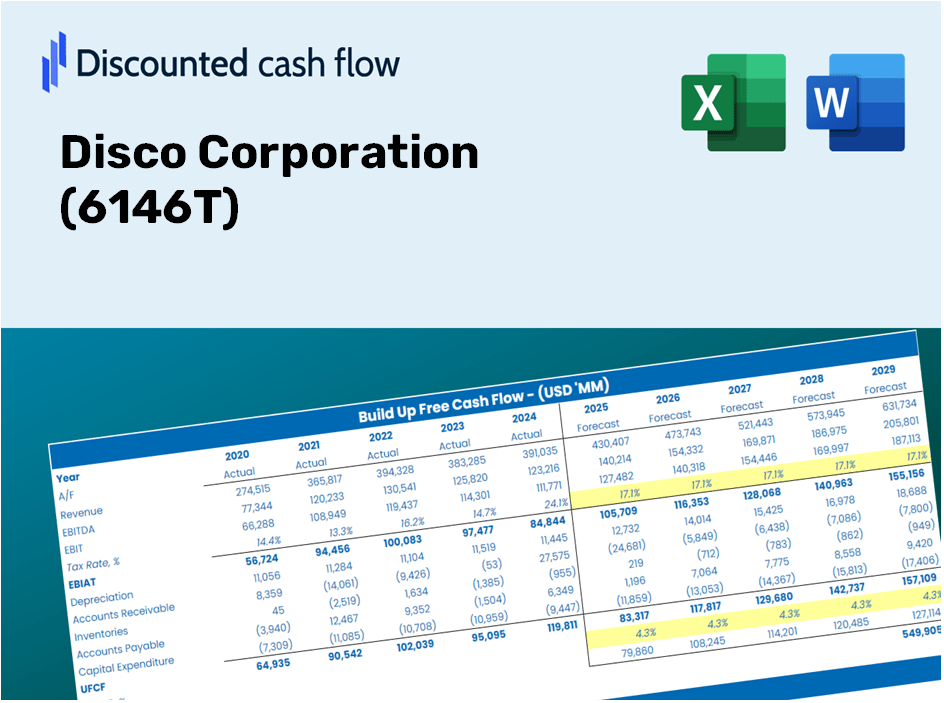
Explorez les prospects financiers de Disco Corporation (6146T) avec notre calculatrice DCF conviviale! Entrez vos projections pour la croissance, les marges et les dépenses pour calculer la valeur intrinsèque de Disco Corporation (6146T) et affiner votre approche d'investissement.
Discounted Cash Flow (DCF) - (USD MM)
| Year | AY1 2021 |
AY2 2022 |
AY3 2023 |
AY4 2024 |
AY5 2025 |
FY1 2026 |
FY2 2027 |
FY3 2028 |
FY4 2029 |
FY5 2030 |
|---|---|---|---|---|---|---|---|---|---|---|
| Revenue | 182,857.0 | 253,781.0 | 284,135.0 | 307,554.0 | 393,313.0 | 478,734.4 | 582,708.0 | 709,263.0 | 863,303.8 | 1,050,799.8 |
| Revenue Growth, % | 0 | 38.79 | 11.96 | 8.24 | 27.88 | 21.72 | 21.72 | 21.72 | 21.72 | 21.72 |
| EBITDA | 60,251.0 | 100,803.0 | 123,155.0 | 125,608.0 | 180,344.0 | 194,086.2 | 236,238.7 | 287,546.0 | 349,996.5 | 426,010.2 |
| EBITDA, % | 32.95 | 39.72 | 43.34 | 40.84 | 45.85 | 40.54 | 40.54 | 40.54 | 40.54 | 40.54 |
| Depreciation | 6,815.0 | 8,551.0 | 10,371.0 | 11,031.0 | 12,198.0 | 16,692.9 | 20,318.4 | 24,731.2 | 30,102.5 | 36,640.2 |
| Depreciation, % | 3.73 | 3.37 | 3.65 | 3.59 | 3.1 | 3.49 | 3.49 | 3.49 | 3.49 | 3.49 |
| EBIT | 53,436.0 | 92,252.0 | 112,784.0 | 114,577.0 | 168,146.0 | 177,393.2 | 215,920.3 | 262,814.8 | 319,894.0 | 389,370.0 |
| EBIT, % | 29.22 | 36.35 | 39.69 | 37.25 | 42.75 | 37.05 | 37.05 | 37.05 | 37.05 | 37.05 |
| Total Cash | 109,809.0 | 125,771.0 | 163,053.0 | 215,486.0 | 229,167.0 | 282,766.1 | 344,178.5 | 418,928.6 | 509,913.4 | 620,658.5 |
| Total Cash, percent | .0 | .0 | .0 | .0 | .0 | .0 | .0 | .0 | .0 | .0 |
| Account Receivables | 33,098.0 | 38,591.0 | 41,260.0 | 46,691.0 | 43,037.0 | 70,806.5 | 86,184.5 | 104,902.5 | 127,685.6 | 155,417.0 |
| Account Receivables, % | 18.1 | 15.21 | 14.52 | 15.18 | 10.94 | 14.79 | 14.79 | 14.79 | 14.79 | 14.79 |
| Inventories | 55,745.0 | 68,477.0 | 91,383.0 | 114,991.0 | 139,002.0 | 155,454.9 | 189,217.3 | 230,312.3 | 280,332.5 | 341,216.4 |
| Inventories, % | 30.49 | 26.98 | 32.16 | 37.39 | 35.34 | 32.47 | 32.47 | 32.47 | 32.47 | 32.47 |
| Accounts Payable | 22,457.0 | 28,950.0 | 26,600.0 | 36,229.0 | 30,868.0 | 50,437.9 | 61,392.2 | 74,725.6 | 90,954.8 | 110,708.7 |
| Accounts Payable, % | 12.28 | 11.41 | 9.36 | 11.78 | 7.85 | 10.54 | 10.54 | 10.54 | 10.54 | 10.54 |
| Capital Expenditure | -21,026.0 | -43,576.0 | -14,208.0 | -16,214.0 | -67,952.0 | -53,827.5 | -65,517.9 | -79,747.4 | -97,067.3 | -118,148.8 |
| Capital Expenditure, % | -11.5 | -17.17 | -5 | -5.27 | -17.28 | -11.24 | -11.24 | -11.24 | -11.24 | -11.24 |
| Tax Rate, % | 26.32 | 26.32 | 26.32 | 26.32 | 26.32 | 26.32 | 26.32 | 26.32 | 26.32 | 26.32 |
| EBITAT | 39,092.5 | 66,206.7 | 82,891.3 | 84,206.7 | 123,891.0 | 129,708.0 | 157,878.6 | 192,167.3 | 233,903.0 | 284,703.1 |
| Depreciation | ||||||||||
| Changes in Account Receivables | ||||||||||
| Changes in Inventories | ||||||||||
| Changes in Accounts Payable | ||||||||||
| Capital Expenditure | ||||||||||
| UFCF | -41,504.5 | 19,449.7 | 51,129.3 | 59,613.7 | 42,419.0 | 67,920.9 | 74,492.9 | 90,671.6 | 110,364.0 | 134,333.4 |
| WACC, % | 13.27 | 13.27 | 13.27 | 13.27 | 13.27 | 13.27 | 13.27 | 13.27 | 13.27 | 13.27 |
| PV UFCF | ||||||||||
| SUM PV UFCF | 319,522.1 | |||||||||
| Long Term Growth Rate, % | 3.00 | |||||||||
| Free cash flow (T + 1) | 138,363 | |||||||||
| Terminal Value | 1,347,474 | |||||||||
| Present Terminal Value | 722,732 | |||||||||
| Enterprise Value | 1,042,254 | |||||||||
| Net Debt | -229,167 | |||||||||
| Equity Value | 1,271,421 | |||||||||
| Diluted Shares Outstanding, MM | 109 | |||||||||
| Equity Value Per Share | 11,689.44 |
What You Will Receive
- Genuine Disco Data: Preloaded financial metrics – including revenue and EBIT – based on real and projected statistics.
- Complete Customization: Modify all essential parameters (highlighted in yellow) such as WACC, growth rates, and tax percentages.
- Instant Value Updates: Automatic recalculations to assess the influence of changes on Disco Corporation’s (6146T) fair value.
- Flexible Excel Template: Designed for quick modifications, scenario analysis, and comprehensive forecasts.
- Efficient and Accurate: Avoid building models from the ground up while ensuring precision and adaptability.
Key Features
- Comprehensive DCF Calculator: Provides in-depth unlevered and levered DCF valuation models tailored for Disco Corporation (6146T).
- WACC Calculator: Features a pre-built Weighted Average Cost of Capital sheet with options for customizable inputs.
- Adjustable Forecast Assumptions: Easily modify growth rates, capital expenditures, and discount rates to fit your analysis.
- Integrated Financial Ratios: Evaluate profitability, leverage, and efficiency ratios specific to Disco Corporation (6146T).
- Interactive Dashboard and Charts: Visual representations provide a summary of key valuation metrics for streamlined analysis.
How It Works
- Step 1: Download the Excel file.
- Step 2: Examine Disco Corporation's pre-filled financial data and forecasts.
- Step 3: Adjust key inputs such as revenue growth, WACC, and tax rates (highlighted cells).
- Step 4: Observe the DCF model refresh in real-time as you modify your assumptions.
- Step 5: Evaluate the outputs and leverage the results for your investment strategies.
Why Opt for This Calculator?
- All-in-One Solution: Features DCF, WACC, and financial ratio analyses for thorough evaluations.
- Adjustable Parameters: Modify the yellow-highlighted cells to explore different scenarios.
- In-Depth Analysis: Automatically determines the intrinsic value and Net Present Value for Disco Corporation (6146T).
- Preloaded Information: Comes equipped with historical and forecasted data for a reliable starting point.
- Industry-Grade Quality: Perfect for finance professionals, investors, and business advisors.
Who Should Utilize This Service?
- Individual Investors: Gain insights to make educated decisions regarding the purchase or sale of Disco Corporation (6146T) stock.
- Financial Analysts: Enhance valuation workflows with comprehensive financial models at your fingertips.
- Consultants: Provide clients with expert valuation analyses in a timely and precise manner.
- Business Owners: Learn how major companies like Disco Corporation (6146T) are appraised to inform your own business strategies.
- Finance Students: Master valuation methodologies utilizing real-world data and practical examples.
Contents of the Template
- Preloaded DISCO Corporation Data: Historical and forecasted financial information, encompassing revenue, EBIT, and capital expenditures.
- DCF and WACC Models: Professional-grade sheets designed for calculating intrinsic value and Weighted Average Cost of Capital.
- Editable Inputs: Yellow-highlighted cells for modifying revenue growth rates, tax rates, and discount rates.
- Financial Statements: Detailed annual and quarterly financials for extensive analysis.
- Key Ratios: Profitability, leverage, and efficiency ratios for performance evaluation.
- Dashboard and Charts: Visual summaries of valuation results and assumptions.
Disclaimer
All information, articles, and product details provided on this website are for general informational and educational purposes only. We do not claim any ownership over, nor do we intend to infringe upon, any trademarks, copyrights, logos, brand names, or other intellectual property mentioned or depicted on this site. Such intellectual property remains the property of its respective owners, and any references here are made solely for identification or informational purposes, without implying any affiliation, endorsement, or partnership.
We make no representations or warranties, express or implied, regarding the accuracy, completeness, or suitability of any content or products presented. Nothing on this website should be construed as legal, tax, investment, financial, medical, or other professional advice. In addition, no part of this site—including articles or product references—constitutes a solicitation, recommendation, endorsement, advertisement, or offer to buy or sell any securities, franchises, or other financial instruments, particularly in jurisdictions where such activity would be unlawful.
All content is of a general nature and may not address the specific circumstances of any individual or entity. It is not a substitute for professional advice or services. Any actions you take based on the information provided here are strictly at your own risk. You accept full responsibility for any decisions or outcomes arising from your use of this website and agree to release us from any liability in connection with your use of, or reliance upon, the content or products found herein.