
|
Heiwa Corporation (6412.T) Valation DCF |
Entièrement Modifiable: Adapté À Vos Besoins Dans Excel Ou Sheets
Conception Professionnelle: Modèles Fiables Et Conformes Aux Normes Du Secteur
Pré-Construits Pour Une Utilisation Rapide Et Efficace
Compatible MAC/PC, entièrement débloqué
Aucune Expertise N'Est Requise; Facile À Suivre
Heiwa Corporation (6412.T) Bundle
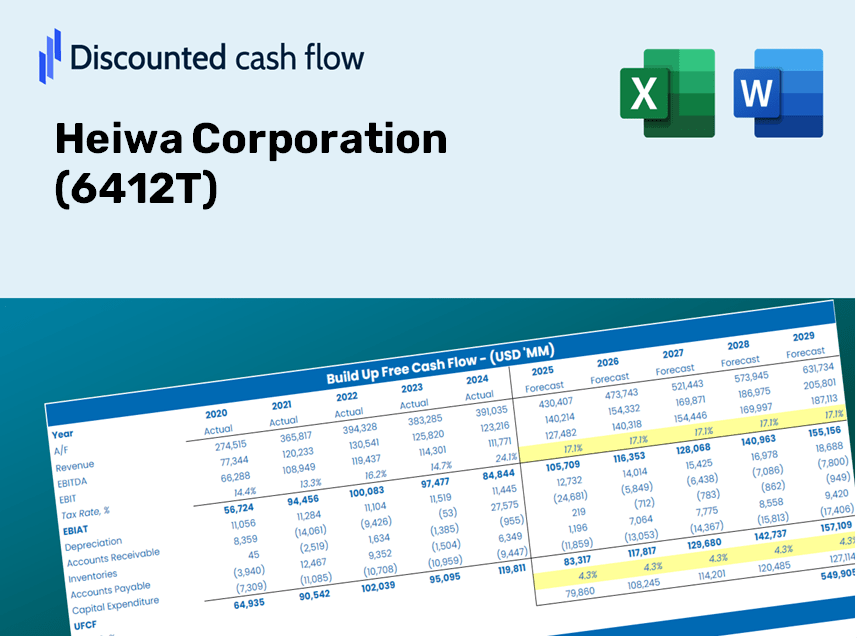
Simplifiez l'évaluation Heiwa Corporation (6412T) avec cette calculatrice DCF personnalisable! Doté de la véritable valeur financière de Heiwa Corporation (6412T) et des prévisions ajustées, vous pouvez tester les scénarios et découvrir la juste valeur Heiwa Corporation (6412T) en minutes.
Discounted Cash Flow (DCF) - (USD MM)
| Year | AY1 2020 |
AY2 2021 |
AY3 2022 |
AY4 2023 |
AY5 2024 |
FY1 2025 |
FY2 2026 |
FY3 2027 |
FY4 2028 |
FY5 2029 |
|---|---|---|---|---|---|---|---|---|---|---|
| Revenue | 107,744.0 | 121,558.0 | 142,290.0 | 136,381.0 | 145,867.0 | 157,784.0 | 170,674.6 | 184,618.3 | 199,701.2 | 216,016.4 |
| Revenue Growth, % | 0 | 12.82 | 17.06 | -4.15 | 6.96 | 8.17 | 8.17 | 8.17 | 8.17 | 8.17 |
| EBITDA | 14,328.0 | 18,680.0 | 35,707.0 | 32,144.0 | 32,326.0 | 31,396.0 | 33,961.0 | 36,735.5 | 39,736.7 | 42,983.1 |
| EBITDA, % | 13.3 | 15.37 | 25.09 | 23.57 | 22.16 | 19.9 | 19.9 | 19.9 | 19.9 | 19.9 |
| Depreciation | 9,016.0 | 10,082.0 | 8,801.0 | 9,004.0 | 9,066.0 | 11,254.6 | 12,174.1 | 13,168.7 | 14,244.5 | 15,408.3 |
| Depreciation, % | 8.37 | 8.29 | 6.19 | 6.6 | 6.22 | 7.13 | 7.13 | 7.13 | 7.13 | 7.13 |
| EBIT | 5,312.0 | 8,598.0 | 26,906.0 | 23,140.0 | 23,260.0 | 20,141.4 | 21,786.9 | 23,566.8 | 25,492.2 | 27,574.9 |
| EBIT, % | 4.93 | 7.07 | 18.91 | 16.97 | 15.95 | 12.77 | 12.77 | 12.77 | 12.77 | 12.77 |
| Total Cash | 70,083.0 | 67,051.0 | 67,716.0 | 57,713.0 | 92,247.0 | 86,261.7 | 93,309.0 | 100,932.2 | 109,178.1 | 118,097.7 |
| Total Cash, percent | .0 | .0 | .0 | .0 | .0 | .0 | .0 | .0 | .0 | .0 |
| Account Receivables | 8,973.0 | 8,369.0 | 8,095.0 | 11,225.0 | 13,301.0 | 12,070.8 | 13,057.0 | 14,123.7 | 15,277.6 | 16,525.7 |
| Account Receivables, % | 8.33 | 6.88 | 5.69 | 8.23 | 9.12 | 7.65 | 7.65 | 7.65 | 7.65 | 7.65 |
| Inventories | 9,936.0 | 9,710.0 | 13,464.0 | 17,525.0 | 19,707.0 | 16,735.3 | 18,102.6 | 19,581.5 | 21,181.3 | 22,911.8 |
| Inventories, % | 9.22 | 7.99 | 9.46 | 12.85 | 13.51 | 10.61 | 10.61 | 10.61 | 10.61 | 10.61 |
| Accounts Payable | 3,954.0 | 3,704.0 | 3,891.0 | 3,241.0 | 8,483.0 | 5,567.7 | 6,022.6 | 6,514.6 | 7,046.8 | 7,622.6 |
| Accounts Payable, % | 3.67 | 3.05 | 2.73 | 2.38 | 5.82 | 3.53 | 3.53 | 3.53 | 3.53 | 3.53 |
| Capital Expenditure | -7,345.0 | -7,007.0 | -7,682.0 | -11,258.0 | -18,799.0 | -12,345.9 | -13,354.5 | -14,445.6 | -15,625.8 | -16,902.3 |
| Capital Expenditure, % | -6.82 | -5.76 | -5.4 | -8.25 | -12.89 | -7.82 | -7.82 | -7.82 | -7.82 | -7.82 |
| Tax Rate, % | 38.76 | 38.76 | 38.76 | 38.76 | 38.76 | 38.76 | 38.76 | 38.76 | 38.76 | 38.76 |
| EBITAT | 2,264.6 | 2,297.2 | 20,898.6 | 16,898.7 | 14,244.7 | 11,331.2 | 12,257.0 | 13,258.3 | 14,341.5 | 15,513.2 |
| Depreciation | ||||||||||
| Changes in Account Receivables | ||||||||||
| Changes in Inventories | ||||||||||
| Changes in Accounts Payable | ||||||||||
| Capital Expenditure | ||||||||||
| UFCF | -11,019.4 | 5,952.2 | 18,724.6 | 6,803.7 | 5,495.7 | 11,526.4 | 9,178.0 | 9,927.8 | 10,738.8 | 11,616.2 |
| WACC, % | 2.32 | 1.87 | 3.31 | 3.17 | 2.84 | 2.7 | 2.7 | 2.7 | 2.7 | 2.7 |
| PV UFCF | ||||||||||
| SUM PV UFCF | 48,909.1 | |||||||||
| Long Term Growth Rate, % | 1.00 | |||||||||
| Free cash flow (T + 1) | 11,732 | |||||||||
| Terminal Value | 689,599 | |||||||||
| Present Terminal Value | 603,554 | |||||||||
| Enterprise Value | 652,464 | |||||||||
| Net Debt | 550,626 | |||||||||
| Equity Value | 101,838 | |||||||||
| Diluted Shares Outstanding, MM | 99 | |||||||||
| Equity Value Per Share | 1,032.55 |
What You Will Receive
- Authentic Heiwa Data: Preloaded financials – including revenue and EBIT – derived from actual and projected figures.
- Comprehensive Customization: Modify all essential parameters (yellow cells) such as WACC, growth %, and tax rates.
- Real-Time Valuation Updates: Automatic recalculations to assess the impact of changes on Heiwa's fair value.
- Flexible Excel Template: Designed for swift modifications, scenario analysis, and in-depth projections.
- Efficient and Precise: Avoid the hassle of building models from the ground up while ensuring accuracy and adaptability.
Key Features
- Comprehensive DCF Calculator: Features detailed unlevered and levered DCF valuation models tailored for Heiwa Corporation (6412T).
- WACC Calculator: Customizable Weighted Average Cost of Capital framework specifically designed for Heiwa Corporation (6412T).
- Adjustable Forecast Assumptions: Easily update growth projections, capital expenditures, and discount rates to reflect Heiwa Corporation (6412T)'s needs.
- Integrated Financial Ratios: Examine profitability, leverage, and efficiency ratios specific to Heiwa Corporation (6412T).
- Visual Dashboard and Charts: Graphic representations highlight key valuation metrics for straightforward analysis of Heiwa Corporation (6412T).
How It Works
- Step 1: Download the prebuilt Excel template featuring Heiwa Corporation’s (6412T) data.
- Step 2: Navigate through the pre-filled sheets to grasp the essential metrics.
- Step 3: Modify forecasts and assumptions in the editable yellow cells (WACC, growth, margins).
- Step 4: Instantly see recalculated results, including the intrinsic value of Heiwa Corporation (6412T).
- Step 5: Make informed investment choices or create reports based on the outputs.
Why Opt for This Calculator?
- All-in-One Solution: Combines DCF, WACC, and financial ratio analyses seamlessly.
- Adjustable Parameters: Modify the yellow-highlighted fields to explore different scenarios.
- In-Depth Analysis: Automatically computes Heiwa Corporation’s intrinsic value and Net Present Value.
- Built-in Data: Access to historical and projected data ensures a reliable foundation.
- High-Quality Standards: Perfect for financial analysts, investors, and business advisors.
Who Should Use Heiwa Corporation (6412T)?
- Investors: Accurately assess the fair value of Heiwa Corporation (6412T) prior to making investment choices.
- CFOs: Utilize a high-quality DCF model for financial reporting and in-depth analysis.
- Consultants: Easily modify the template for client valuation reports concerning Heiwa Corporation (6412T).
- Entrepreneurs: Explore financial modeling techniques employed by leading companies in the industry.
- Educators: Incorporate it as a resource to illustrate various valuation methodologies.
Contents of the Template
- Historical Data: Features Heiwa Corporation’s previous financial performance and baseline forecasts.
- DCF and Levered DCF Models: Comprehensive templates for calculating the intrinsic value of Heiwa Corporation (6412T).
- WACC Sheet: Ready-to-use calculations for Weighted Average Cost of Capital.
- Editable Inputs: Customize key metrics such as growth rates, EBITDA %, and CAPEX assumptions.
- Quarterly and Annual Statements: A thorough overview of Heiwa Corporation’s financials.
- Interactive Dashboard: Dynamically visualize valuation results and forecasts.
Disclaimer
All information, articles, and product details provided on this website are for general informational and educational purposes only. We do not claim any ownership over, nor do we intend to infringe upon, any trademarks, copyrights, logos, brand names, or other intellectual property mentioned or depicted on this site. Such intellectual property remains the property of its respective owners, and any references here are made solely for identification or informational purposes, without implying any affiliation, endorsement, or partnership.
We make no representations or warranties, express or implied, regarding the accuracy, completeness, or suitability of any content or products presented. Nothing on this website should be construed as legal, tax, investment, financial, medical, or other professional advice. In addition, no part of this site—including articles or product references—constitutes a solicitation, recommendation, endorsement, advertisement, or offer to buy or sell any securities, franchises, or other financial instruments, particularly in jurisdictions where such activity would be unlawful.
All content is of a general nature and may not address the specific circumstances of any individual or entity. It is not a substitute for professional advice or services. Any actions you take based on the information provided here are strictly at your own risk. You accept full responsibility for any decisions or outcomes arising from your use of this website and agree to release us from any liability in connection with your use of, or reliance upon, the content or products found herein.