
|
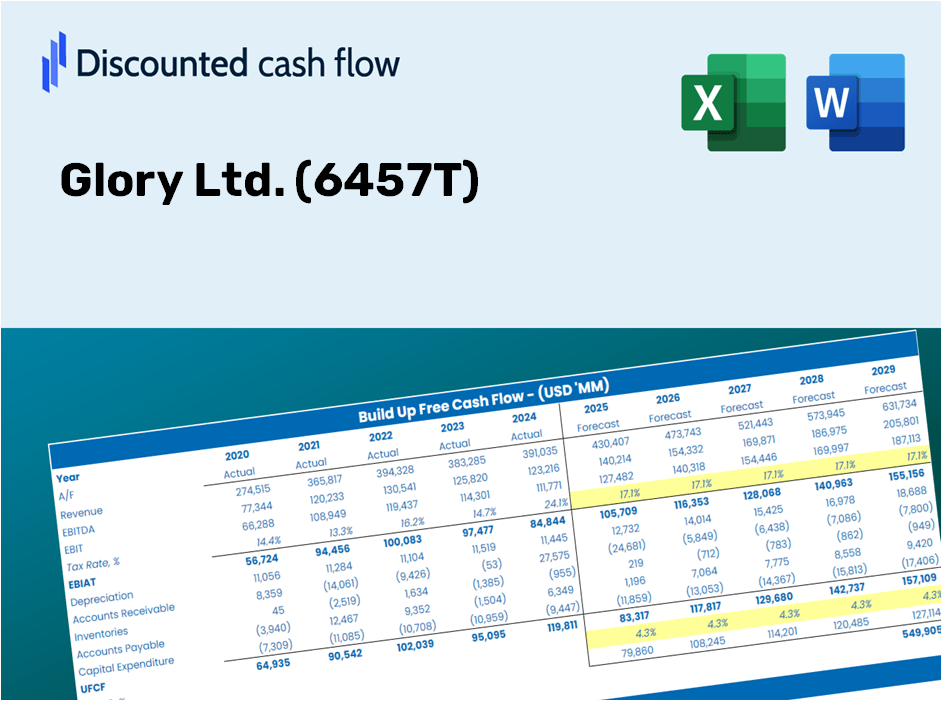
Glory Ltd. (6457.T) Évaluation DCF |
Entièrement Modifiable: Adapté À Vos Besoins Dans Excel Ou Sheets
Conception Professionnelle: Modèles Fiables Et Conformes Aux Normes Du Secteur
Pré-Construits Pour Une Utilisation Rapide Et Efficace
Compatible MAC/PC, entièrement débloqué
Aucune Expertise N'Est Requise; Facile À Suivre
Glory Ltd. (6457.T) Bundle
Vous cherchez à évaluer la valeur intrinsèque de Glory Ltd.? Notre (6457T) Calculator DCF fusionne des données réelles avec des fonctionnalités de personnalisation approfondies, vous permettant d'ajuster les prévisions et d'améliorer vos décisions d'investissement.
Discounted Cash Flow (DCF) - (USD MM)
| Year | AY1 2021 |
AY2 2022 |
AY3 2023 |
AY4 2024 |
AY5 2025 |
FY1 2026 |
FY2 2027 |
FY3 2028 |
FY4 2029 |
FY5 2030 |
|---|---|---|---|---|---|---|---|---|---|---|
| Revenue | 217,423.0 | 226,562.0 | 255,857.0 | 372,478.0 | 369,017.0 | 426,016.2 | 491,819.7 | 567,787.3 | 655,489.0 | 756,737.3 |
| Revenue Growth, % | 0 | 4.2 | 12.93 | 45.58 | -0.92918 | 15.45 | 15.45 | 15.45 | 15.45 | 15.45 |
| EBITDA | 28,357.0 | 31,628.0 | 12,942.0 | 69,678.0 | 54,416.0 | 55,819.5 | 64,441.6 | 74,395.3 | 85,886.6 | 99,152.9 |
| EBITDA, % | 13.04 | 13.96 | 5.06 | 18.71 | 14.75 | 13.1 | 13.1 | 13.1 | 13.1 | 13.1 |
| Depreciation | 15,208.0 | 17,310.0 | 18,465.0 | 20,940.0 | 24,033.0 | 28,957.5 | 33,430.4 | 38,594.1 | 44,555.4 | 51,437.5 |
| Depreciation, % | 6.99 | 7.64 | 7.22 | 5.62 | 6.51 | 6.8 | 6.8 | 6.8 | 6.8 | 6.8 |
| EBIT | 13,149.0 | 14,318.0 | -5,523.0 | 48,738.0 | 30,383.0 | 26,862.0 | 31,011.2 | 35,801.3 | 41,331.2 | 47,715.3 |
| EBIT, % | 6.05 | 6.32 | -2.16 | 13.08 | 8.23 | 6.31 | 6.31 | 6.31 | 6.31 | 6.31 |
| Total Cash | 66,238.0 | 52,366.0 | 38,133.0 | 35,224.0 | 51,580.0 | 78,316.0 | 90,412.9 | 104,378.3 | 120,500.8 | 139,113.6 |
| Total Cash, percent | .0 | .0 | .0 | .0 | .0 | .0 | .0 | .0 | .0 | .0 |
| Account Receivables | 56,386.0 | 52,704.0 | 60,718.0 | 88,608.0 | 69,112.0 | 98,362.9 | 113,556.2 | 131,096.4 | 151,345.8 | 174,723.0 |
| Account Receivables, % | 25.93 | 23.26 | 23.73 | 23.79 | 18.73 | 23.09 | 23.09 | 23.09 | 23.09 | 23.09 |
| Inventories | 52,516.0 | 71,768.0 | 94,998.0 | 111,067.0 | 95,639.0 | 126,693.6 | 146,263.0 | 168,855.2 | 194,936.9 | 225,047.3 |
| Inventories, % | 24.15 | 31.68 | 37.13 | 29.82 | 25.92 | 29.74 | 29.74 | 29.74 | 29.74 | 29.74 |
| Accounts Payable | 17,072.0 | 21,631.0 | 25,473.0 | 17,678.0 | 19,394.0 | 31,829.4 | 36,745.9 | 42,421.7 | 48,974.3 | 56,539.0 |
| Accounts Payable, % | 7.85 | 9.55 | 9.96 | 4.75 | 5.26 | 7.47 | 7.47 | 7.47 | 7.47 | 7.47 |
| Capital Expenditure | -8,464.0 | -8,233.0 | -6,933.0 | -8,252.0 | -5,093.0 | -11,785.4 | -13,605.8 | -15,707.3 | -18,133.5 | -20,934.5 |
| Capital Expenditure, % | -3.89 | -3.63 | -2.71 | -2.22 | -1.38 | -2.77 | -2.77 | -2.77 | -2.77 | -2.77 |
| Tax Rate, % | 42.35 | 42.35 | 42.35 | 42.35 | 42.35 | 42.35 | 42.35 | 42.35 | 42.35 | 42.35 |
| EBITAT | 5,958.3 | 6,708.9 | -7,908.5 | 30,893.6 | 17,514.3 | 16,826.5 | 19,425.6 | 22,426.1 | 25,890.1 | 29,889.1 |
| Depreciation | ||||||||||
| Changes in Account Receivables | ||||||||||
| Changes in Inventories | ||||||||||
| Changes in Accounts Payable | ||||||||||
| Capital Expenditure | ||||||||||
| UFCF | -79,127.7 | 4,774.9 | -23,778.5 | -8,172.4 | 73,094.3 | -13,871.4 | 9,403.9 | 10,856.4 | 12,533.3 | 14,469.3 |
| WACC, % | 3.78 | 3.8 | 4.38 | 3.98 | 3.92 | 3.97 | 3.97 | 3.97 | 3.97 | 3.97 |
| PV UFCF | ||||||||||
| SUM PV UFCF | 27,653.7 | |||||||||
| Long Term Growth Rate, % | 2.00 | |||||||||
| Free cash flow (T + 1) | 14,759 | |||||||||
| Terminal Value | 749,331 | |||||||||
| Present Terminal Value | 616,797 | |||||||||
| Enterprise Value | 644,451 | |||||||||
| Net Debt | 34,018 | |||||||||
| Equity Value | 610,433 | |||||||||
| Diluted Shares Outstanding, MM | 56 | |||||||||
| Equity Value Per Share | 10,941.62 |
What You Will Receive
- Pre-Filled Financial Model: Glory Ltd.'s actual data allows for accurate DCF valuation.
- Comprehensive Forecast Control: Modify revenue growth, profit margins, WACC, and other essential factors.
- Real-Time Calculations: Automatic updates provide immediate feedback as you make adjustments.
- Investor-Ready Template: A polished Excel file crafted for high-quality valuation.
- Customizable and Reusable: Designed for versatility, enabling repetitive use for in-depth forecasts.
Key Features of Glory Ltd. (6457T)
- Authentic Financial Data: Gain access to precise pre-loaded historical figures and future projections.
- Adjustable Forecast Parameters: Modify the yellow-highlighted cells including WACC, growth rates, and profit margins as needed.
- Interactive Calculations: Enjoy automatic updates for DCF, Net Present Value (NPV), and cash flow analyses.
- User-Friendly Dashboard: Simplified charts and summaries for a clear visualization of your valuation outcomes.
- Designed for All Skill Levels: A straightforward and intuitive layout tailored for investors, CFOs, and consultants alike.
How It Operates
- Download the Template: Gain immediate access to the Excel-based Glory Ltd. (6457T) DCF Calculator.
- Input Your Assumptions: Modify the yellow-highlighted cells for growth rates, WACC, margins, and other variables.
- Instant Calculations: The model will automatically refresh to provide Glory Ltd.’s intrinsic value.
- Test Scenarios: Experiment with various assumptions to assess potential changes in valuation.
- Analyze and Decide: Utilize the findings to inform your investment or financial analysis decisions.
Reasons to Select This Calculator for Glory Ltd. (6457T)
- User-Friendly Interface: Crafted for both novices and seasoned users.
- Customizable Inputs: Easily adjust variables to suit your analysis needs.
- Real-Time Updates: Witness immediate changes in Glory Ltd.’s valuation as you modify inputs.
- Preloaded Data: Comes with Glory Ltd.’s actual financial data for swift evaluations.
- Preferred by Experts: Employed by investors and analysts for making well-informed choices.
Who Is This Product Intended For?
- Investors: Precisely assess the fair value of Glory Ltd. (6457T) before making investment choices.
- CFOs: Utilize a high-quality DCF model for comprehensive financial reporting and analysis.
- Consultants: Effortlessly customize the template for client valuation reports.
- Entrepreneurs: Discover insights into the financial modeling practices of Fortune 500 companies.
- Educators: Employ it as a pedagogical tool to illustrate valuation methodologies.
Contents of the Template
- Comprehensive DCF Model: An editable template with thorough valuation calculations.
- Real-World Data: Glory Ltd.’s (6457T) historical and projected financials preloaded for in-depth analysis.
- Customizable Parameters: Modify WACC, growth rates, and tax assumptions to explore various scenarios.
- Financial Statements: Detailed annual and quarterly breakdowns for enhanced insights.
- Key Ratios: Integrated analysis of profitability, efficiency, and leverage.
- Dashboard with Visual Outputs: Charts and tables that present clear, actionable results.
Disclaimer
All information, articles, and product details provided on this website are for general informational and educational purposes only. We do not claim any ownership over, nor do we intend to infringe upon, any trademarks, copyrights, logos, brand names, or other intellectual property mentioned or depicted on this site. Such intellectual property remains the property of its respective owners, and any references here are made solely for identification or informational purposes, without implying any affiliation, endorsement, or partnership.
We make no representations or warranties, express or implied, regarding the accuracy, completeness, or suitability of any content or products presented. Nothing on this website should be construed as legal, tax, investment, financial, medical, or other professional advice. In addition, no part of this site—including articles or product references—constitutes a solicitation, recommendation, endorsement, advertisement, or offer to buy or sell any securities, franchises, or other financial instruments, particularly in jurisdictions where such activity would be unlawful.
All content is of a general nature and may not address the specific circumstances of any individual or entity. It is not a substitute for professional advice or services. Any actions you take based on the information provided here are strictly at your own risk. You accept full responsibility for any decisions or outcomes arising from your use of this website and agree to release us from any liability in connection with your use of, or reliance upon, the content or products found herein.