
|
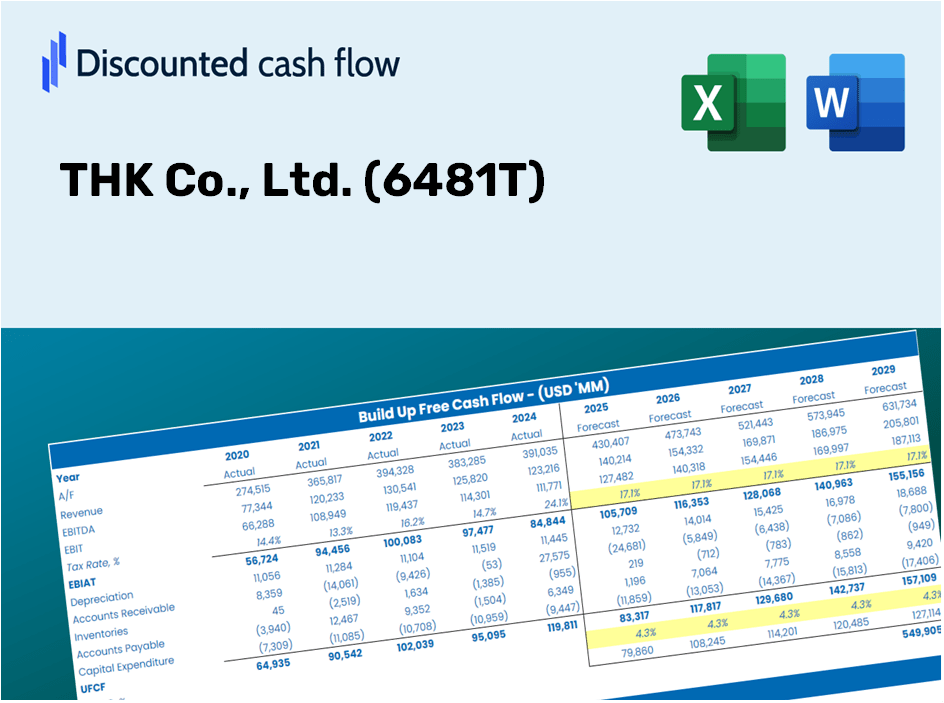
Thk Co., Ltd. (6481.T) Évaluation DCF |
Entièrement Modifiable: Adapté À Vos Besoins Dans Excel Ou Sheets
Conception Professionnelle: Modèles Fiables Et Conformes Aux Normes Du Secteur
Pré-Construits Pour Une Utilisation Rapide Et Efficace
Compatible MAC/PC, entièrement débloqué
Aucune Expertise N'Est Requise; Facile À Suivre
THK Co., Ltd. (6481.T) Bundle
Que vous soyez un investisseur ou un analyste, cette (6481T) Calculator DCF est votre ressource incontournable pour une évaluation précise. Équipé de données réelles de Thk Co., Ltd., vous pouvez ajuster les prévisions et observer les effets en temps réel.
Discounted Cash Flow (DCF) - (USD MM)
| Year | AY1 2020 |
AY2 2021 |
AY3 2022 |
AY4 2023 |
AY5 2024 |
FY1 2025 |
FY2 2026 |
FY3 2027 |
FY4 2028 |
FY5 2029 |
|---|---|---|---|---|---|---|---|---|---|---|
| Revenue | 218,998.0 | 318,188.0 | 393,687.0 | 351,939.0 | 352,759.0 | 404,481.5 | 463,787.6 | 531,789.4 | 609,761.8 | 699,166.8 |
| Revenue Growth, % | 0 | 45.29 | 23.73 | -10.6 | 0.23299 | 14.66 | 14.66 | 14.66 | 14.66 | 14.66 |
| EBITDA | 9,162.0 | 48,696.0 | 56,326.0 | 44,851.0 | 41,275.0 | 47,113.7 | 54,021.7 | 61,942.5 | 71,024.6 | 81,438.5 |
| EBITDA, % | 4.18 | 15.3 | 14.31 | 12.74 | 11.7 | 11.65 | 11.65 | 11.65 | 11.65 | 11.65 |
| Depreciation | 18,675.0 | 18,748.0 | 20,834.0 | 21,803.0 | 23,981.0 | 26,457.0 | 30,336.2 | 34,784.2 | 39,884.3 | 45,732.3 |
| Depreciation, % | 8.53 | 5.89 | 5.29 | 6.2 | 6.8 | 6.54 | 6.54 | 6.54 | 6.54 | 6.54 |
| EBIT | -9,513.0 | 29,948.0 | 35,492.0 | 23,048.0 | 17,294.0 | 20,656.7 | 23,685.5 | 27,158.3 | 31,140.3 | 35,706.2 |
| EBIT, % | -4.34 | 9.41 | 9.02 | 6.55 | 4.9 | 5.11 | 5.11 | 5.11 | 5.11 | 5.11 |
| Total Cash | 158,853.0 | 151,430.0 | 163,835.0 | 156,486.0 | 140,295.0 | 198,987.0 | 228,163.0 | 261,616.9 | 299,975.9 | 343,959.2 |
| Total Cash, percent | .0 | .0 | .0 | .0 | .0 | .0 | .0 | .0 | .0 | .0 |
| Account Receivables | 59,505.0 | 86,293.0 | 96,665.0 | 78,621.0 | 81,474.0 | 100,538.7 | 115,280.0 | 132,182.6 | 151,563.6 | 173,786.3 |
| Account Receivables, % | 27.17 | 27.12 | 24.55 | 22.34 | 23.1 | 24.86 | 24.86 | 24.86 | 24.86 | 24.86 |
| Inventories | 47,237.0 | 64,378.0 | 77,630.0 | 82,460.0 | 91,660.0 | 89,742.3 | 102,900.5 | 117,988.1 | 135,287.8 | 155,124.1 |
| Inventories, % | 21.57 | 20.23 | 19.72 | 23.43 | 25.98 | 22.19 | 22.19 | 22.19 | 22.19 | 22.19 |
| Accounts Payable | 33,768.0 | 41,321.0 | 41,630.0 | 40,881.0 | 34,040.0 | 48,736.5 | 55,882.4 | 64,076.0 | 73,471.0 | 84,243.5 |
| Accounts Payable, % | 15.42 | 12.99 | 10.57 | 11.62 | 9.65 | 12.05 | 12.05 | 12.05 | 12.05 | 12.05 |
| Capital Expenditure | -18,009.0 | -19,248.0 | -29,407.0 | -27,045.0 | -29,563.0 | -30,584.7 | -35,069.2 | -40,211.1 | -46,106.9 | -52,867.3 |
| Capital Expenditure, % | -8.22 | -6.05 | -7.47 | -7.68 | -8.38 | -7.56 | -7.56 | -7.56 | -7.56 | -7.56 |
| Tax Rate, % | 44.42 | 44.42 | 44.42 | 44.42 | 44.42 | 44.42 | 44.42 | 44.42 | 44.42 | 44.42 |
| EBITAT | -9,774.2 | 22,979.4 | 21,136.1 | 16,767.7 | 9,612.5 | 15,063.6 | 17,272.2 | 19,804.7 | 22,708.5 | 26,038.1 |
| Depreciation | ||||||||||
| Changes in Account Receivables | ||||||||||
| Changes in Inventories | ||||||||||
| Changes in Accounts Payable | ||||||||||
| Capital Expenditure | ||||||||||
| UFCF | -82,082.2 | -13,896.6 | -10,751.9 | 23,990.7 | -14,863.5 | 8,485.3 | -8,214.4 | -9,418.8 | -10,799.8 | -12,383.3 |
| WACC, % | 5.02 | 4.87 | 4.76 | 4.85 | 4.74 | 4.85 | 4.85 | 4.85 | 4.85 | 4.85 |
| PV UFCF | ||||||||||
| SUM PV UFCF | -26,260.5 | |||||||||
| Long Term Growth Rate, % | 2.00 | |||||||||
| Free cash flow (T + 1) | -12,631 | |||||||||
| Terminal Value | -443,454 | |||||||||
| Present Terminal Value | -349,979 | |||||||||
| Enterprise Value | -376,239 | |||||||||
| Net Debt | -41,779 | |||||||||
| Equity Value | -334,460 | |||||||||
| Diluted Shares Outstanding, MM | 123 | |||||||||
| Equity Value Per Share | -2,728.55 |
What You Will Gain
- Adjustable Forecast Inputs: Easily modify key assumptions (growth %, margins, WACC) to create various scenarios.
- Real-World Financial Data: THK Co., Ltd.'s (6481T) financial metrics pre-loaded to facilitate your analysis.
- Automated DCF Calculations: The template computes Net Present Value (NPV) and intrinsic value automatically.
- Customizable and Professional Design: A sleek Excel model tailored to meet your valuation requirements.
- Designed for Analysts and Investors: Perfect for evaluating projections, confirming strategies, and enhancing efficiency.
Key Features
- Real-Life THK Data: Pre-filled with THK Co., Ltd.'s historical financials and forward-looking projections.
- Fully Customizable Inputs: Modify revenue growth, profit margins, WACC, tax rates, and capital expenditures to suit your analysis.
- Dynamic Valuation Model: Automatically updates Net Present Value (NPV) and intrinsic value based on your customized inputs.
- Scenario Testing: Develop various forecast scenarios to explore different valuation possibilities.
- User-Friendly Design: Intuitive and structured, catering to both professionals and those new to financial analysis.
How It Functions
- 1. Access the Template: Download and open the Excel file containing THK Co., Ltd.'s preloaded data.
- 2. Adjust Assumptions: Modify essential inputs like growth rates, WACC, and capital expenditures.
- 3. View Results in Real-Time: The DCF model automatically calculates the intrinsic value and NPV.
- 4. Explore Different Scenarios: Analyze various forecasts to evaluate different valuation outcomes.
- 5. Act with Assurance: Present professional valuation insights to back your decisions confidently.
Why Opt for This Calculator for THK Co., Ltd. (6481T)?
- All-in-One Solution: Offers DCF, WACC, and financial ratio analyses seamlessly integrated.
- Adjustable Inputs: Modify the highlighted fields to explore different financial scenarios.
- In-Depth Analysis: Automatically computes THK's intrinsic value and Net Present Value.
- Curated Data: Comes with historical and projected data for reliable starting metrics.
- Expert-Level Insights: Perfect for financial analysts, investors, and business consultants seeking precision.
Who Can Benefit from THK Co., Ltd. (6481T)?
- Investors: Make informed investment choices with our comprehensive analysis tools.
- Financial Analysts: Streamline your workflow with our customizable financial models.
- Consultants: Easily modify our templates for impactful client presentations and reports.
- Finance Enthusiasts: Enhance your knowledge of market dynamics with practical insights.
- Educators and Students: Utilize our resources as a hands-on learning aid in finance studies.
Overview of the Template Features
- Comprehensive DCF Model: An editable template that includes detailed valuation computations.
- Real-World Data: THK Co., Ltd.'s (6481T) historical and projected financial information is preloaded for your analysis.
- Customizable Parameters: Modify WACC, growth rates, and tax assumptions to explore different scenarios.
- Financial Statements: Complete annual and quarterly reports for in-depth insights.
- Key Ratios: Integrated analysis for assessing profitability, efficiency, and leverage metrics.
- Dashboard with Visual Outputs: Charts and tables designed to present clear, actionable results.
Disclaimer
All information, articles, and product details provided on this website are for general informational and educational purposes only. We do not claim any ownership over, nor do we intend to infringe upon, any trademarks, copyrights, logos, brand names, or other intellectual property mentioned or depicted on this site. Such intellectual property remains the property of its respective owners, and any references here are made solely for identification or informational purposes, without implying any affiliation, endorsement, or partnership.
We make no representations or warranties, express or implied, regarding the accuracy, completeness, or suitability of any content or products presented. Nothing on this website should be construed as legal, tax, investment, financial, medical, or other professional advice. In addition, no part of this site—including articles or product references—constitutes a solicitation, recommendation, endorsement, advertisement, or offer to buy or sell any securities, franchises, or other financial instruments, particularly in jurisdictions where such activity would be unlawful.
All content is of a general nature and may not address the specific circumstances of any individual or entity. It is not a substitute for professional advice or services. Any actions you take based on the information provided here are strictly at your own risk. You accept full responsibility for any decisions or outcomes arising from your use of this website and agree to release us from any liability in connection with your use of, or reliance upon, the content or products found herein.