
|
Mitsubishi Electric Corporation (6503.T) Évaluation DCF |
Entièrement Modifiable: Adapté À Vos Besoins Dans Excel Ou Sheets
Conception Professionnelle: Modèles Fiables Et Conformes Aux Normes Du Secteur
Pré-Construits Pour Une Utilisation Rapide Et Efficace
Compatible MAC/PC, entièrement débloqué
Aucune Expertise N'Est Requise; Facile À Suivre
Mitsubishi Electric Corporation (6503.T) Bundle
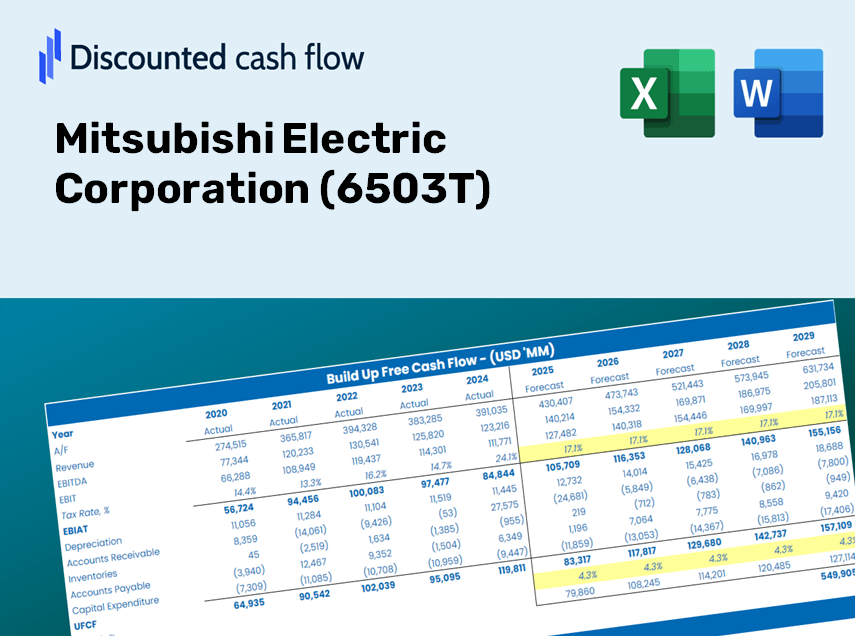
Simplifiez l'évaluation de Mitsubishi Electric Corporation (6503T) avec cette calculatrice DCF personnalisable! Avec Real Mitsubishi Electric Corporation (6503T) Financials and Rajustement des intrants de prévision, vous pouvez tester les scénarios et découvrir la juste valeur Mitsubishi Electric Corporation (6503T) en minutes.
Discounted Cash Flow (DCF) - (USD MM)
| Year | AY1 2021 |
AY2 2022 |
AY3 2023 |
AY4 2024 |
AY5 2025 |
FY1 2026 |
FY2 2027 |
FY3 2028 |
FY4 2029 |
FY5 2030 |
|---|---|---|---|---|---|---|---|---|---|---|
| Revenue | 4,191,433.0 | 4,476,758.0 | 5,003,694.0 | 5,257,914.0 | 5,521,711.0 | 5,917,557.1 | 6,341,780.9 | 6,796,417.0 | 7,283,645.5 | 7,805,802.9 |
| Revenue Growth, % | 0 | 6.81 | 11.77 | 5.08 | 5.02 | 7.17 | 7.17 | 7.17 | 7.17 | 7.17 |
| EBITDA | 455,651.0 | 470,743.0 | 488,123.0 | 546,558.0 | 634,112.0 | 627,503.2 | 672,488.3 | 720,698.3 | 772,364.5 | 827,734.5 |
| EBITDA, % | 10.87 | 10.52 | 9.76 | 10.39 | 11.48 | 10.6 | 10.6 | 10.6 | 10.6 | 10.6 |
| Depreciation | 213,320.0 | 206,813.0 | 213,843.0 | 200,829.0 | 221,428.0 | 258,153.7 | 276,660.5 | 296,494.1 | 317,749.4 | 340,528.6 |
| Depreciation, % | 5.09 | 4.62 | 4.27 | 3.82 | 4.01 | 4.36 | 4.36 | 4.36 | 4.36 | 4.36 |
| EBIT | 242,331.0 | 263,930.0 | 274,280.0 | 345,729.0 | 412,684.0 | 369,349.5 | 395,827.8 | 424,204.3 | 454,615.1 | 487,206.0 |
| EBIT, % | 5.78 | 5.9 | 5.48 | 6.58 | 7.47 | 6.24 | 6.24 | 6.24 | 6.24 | 6.24 |
| Total Cash | 767,406.0 | 727,179.0 | 645,870.0 | 765,384.0 | 757,331.0 | 896,303.0 | 960,558.1 | 1,029,419.6 | 1,103,217.7 | 1,182,306.3 |
| Total Cash, percent | .0 | .0 | .0 | .0 | .0 | .0 | .0 | .0 | .0 | .0 |
| Account Receivables | 1,181,062.0 | 1,232,102.0 | 1,346,932.0 | 1,408,534.0 | 1,490,265.0 | 1,614,273.7 | 1,729,999.4 | 1,854,021.4 | 1,986,934.4 | 2,129,375.7 |
| Account Receivables, % | 28.18 | 27.52 | 26.92 | 26.79 | 26.99 | 27.28 | 27.28 | 27.28 | 27.28 | 27.28 |
| Inventories | 743,782.0 | 959,660.0 | 1,209,254.0 | 1,253,493.0 | 1,244,959.0 | 1,298,735.1 | 1,391,840.1 | 1,491,619.8 | 1,598,552.6 | 1,713,151.2 |
| Inventories, % | 17.75 | 21.44 | 24.17 | 23.84 | 22.55 | 21.95 | 21.95 | 21.95 | 21.95 | 21.95 |
| Accounts Payable | 541,774.0 | 601,606.0 | 644,456.0 | 589,142.0 | 601,978.0 | 726,092.1 | 778,144.9 | 833,929.4 | 893,712.9 | 957,782.4 |
| Accounts Payable, % | 12.93 | 13.44 | 12.88 | 11.2 | 10.9 | 12.27 | 12.27 | 12.27 | 12.27 | 12.27 |
| Capital Expenditure | -188,359.0 | -156,062.0 | -175,556.0 | -175,756.0 | -193,988.0 | -217,107.6 | -232,671.9 | -249,351.9 | -267,227.7 | -286,385.0 |
| Capital Expenditure, % | -4.49 | -3.49 | -3.51 | -3.34 | -3.51 | -3.67 | -3.67 | -3.67 | -3.67 | -3.67 |
| Tax Rate, % | 18.63 | 18.63 | 18.63 | 18.63 | 18.63 | 18.63 | 18.63 | 18.63 | 18.63 | 18.63 |
| EBITAT | 180,874.0 | 192,014.1 | 200,803.9 | 269,275.2 | 335,799.6 | 280,600.9 | 300,716.9 | 322,275.0 | 345,378.6 | 370,138.5 |
| Depreciation | ||||||||||
| Changes in Account Receivables | ||||||||||
| Changes in Inventories | ||||||||||
| Changes in Accounts Payable | ||||||||||
| Capital Expenditure | ||||||||||
| UFCF | -1,177,235.0 | 35,679.1 | -82,483.1 | 133,193.2 | 302,878.6 | 267,976.3 | 187,927.7 | 201,400.0 | 215,838.2 | 231,311.4 |
| WACC, % | 6.01 | 6 | 6 | 6.01 | 6.02 | 6.01 | 6.01 | 6.01 | 6.01 | 6.01 |
| PV UFCF | ||||||||||
| SUM PV UFCF | 932,794.6 | |||||||||
| Long Term Growth Rate, % | 3.00 | |||||||||
| Free cash flow (T + 1) | 238,251 | |||||||||
| Terminal Value | 7,922,522 | |||||||||
| Present Terminal Value | 5,918,143 | |||||||||
| Enterprise Value | 6,850,938 | |||||||||
| Net Debt | -396,670 | |||||||||
| Equity Value | 7,247,608 | |||||||||
| Diluted Shares Outstanding, MM | 2,082 | |||||||||
| Equity Value Per Share | 3,481.89 |
Benefits You Will Enjoy
- Pre-Filled Financial Model: Leverage Mitsubishi Electric Corporation's (6503T) actual data for accurate DCF valuation.
- Complete Forecast Control: Modify revenue growth, profit margins, WACC, and other essential variables.
- Instant Calculations: Real-time updates allow you to view results immediately as you make adjustments.
- Investor-Ready Template: A polished Excel file crafted for professional-level valuation.
- Customizable and Reusable: Designed for adaptability, enabling repeated use for comprehensive forecasts.
Key Features
- Pre-Loaded Data: Mitsubishi Electric Corporation’s historical financial statements and pre-filled forecasts.
- Fully Adjustable Inputs: Modify WACC, tax rates, revenue growth, and EBITDA margins as needed.
- Instant Results: Watch Mitsubishi Electric Corporation's intrinsic value recalculate instantly.
- Clear Visual Outputs: Dashboard charts showcase valuation results and critical metrics.
- Built for Accuracy: A reliable tool designed for analysts, investors, and finance professionals.
How It Works
- Download: Obtain the ready-to-use Excel file containing Mitsubishi Electric Corporation’s (6503T) financial data.
- Customize: Tailor your projections, including revenue growth, EBITDA %, and WACC adjustments.
- Update Automatically: The intrinsic value and NPV calculations refresh in real-time.
- Test Scenarios: Generate multiple projections and instantly compare the results.
- Make Decisions: Utilize the valuation outcomes to inform your investment strategy.
Why Opt for Mitsubishi Electric Corporation's (6503T) Calculator?
- Time Efficient: Skip the hassle of building a DCF model from the ground up – it’s ready for immediate use.
- Enhanced Accuracy: Dependable financial data and formulas minimize valuation errors.
- Completely Customizable: Adjust the model to align with your specific assumptions and forecasts.
- User-Friendly: Intuitive charts and outputs make it easy to comprehend the results.
- Preferred by Professionals: Crafted for experts who prioritize accuracy and functionality.
Who Can Benefit from Mitsubishi Electric Corporation (6503T)?
- Investors: Leverage a high-quality valuation tool to make informed investment choices.
- Financial Analysts: Streamline your workflow with a ready-to-customize DCF model.
- Consultants: Effortlessly modify the template for engaging client presentations or detailed reports.
- Finance Enthusiasts: Enhance your knowledge of valuation methods through practical, real-world scenarios.
- Educators and Students: Utilize this as an effective resource for learning in finance-focused courses.
What the Template Includes
- Preloaded 6503T Data: Historical and forecasted financial information, covering revenue, EBIT, and capital expenditures.
- DCF and WACC Models: Advanced spreadsheets for determining intrinsic value and Weighted Average Cost of Capital.
- Editable Inputs: Yellow-highlighted cells enabling adjustments to revenue growth, tax rates, and discount rates.
- Financial Statements: Detailed annual and quarterly financials for comprehensive analysis.
- Key Ratios: Metrics for profitability, leverage, and efficiency to assess performance.
- Dashboard and Charts: Visual representations of valuation results and underlying assumptions.
Disclaimer
All information, articles, and product details provided on this website are for general informational and educational purposes only. We do not claim any ownership over, nor do we intend to infringe upon, any trademarks, copyrights, logos, brand names, or other intellectual property mentioned or depicted on this site. Such intellectual property remains the property of its respective owners, and any references here are made solely for identification or informational purposes, without implying any affiliation, endorsement, or partnership.
We make no representations or warranties, express or implied, regarding the accuracy, completeness, or suitability of any content or products presented. Nothing on this website should be construed as legal, tax, investment, financial, medical, or other professional advice. In addition, no part of this site—including articles or product references—constitutes a solicitation, recommendation, endorsement, advertisement, or offer to buy or sell any securities, franchises, or other financial instruments, particularly in jurisdictions where such activity would be unlawful.
All content is of a general nature and may not address the specific circumstances of any individual or entity. It is not a substitute for professional advice or services. Any actions you take based on the information provided here are strictly at your own risk. You accept full responsibility for any decisions or outcomes arising from your use of this website and agree to release us from any liability in connection with your use of, or reliance upon, the content or products found herein.