
|
PHC Holdings Corporation (6523.T) Évaluation DCF |
Entièrement Modifiable: Adapté À Vos Besoins Dans Excel Ou Sheets
Conception Professionnelle: Modèles Fiables Et Conformes Aux Normes Du Secteur
Pré-Construits Pour Une Utilisation Rapide Et Efficace
Compatible MAC/PC, entièrement débloqué
Aucune Expertise N'Est Requise; Facile À Suivre
PHC Holdings Corporation (6523.T) Bundle
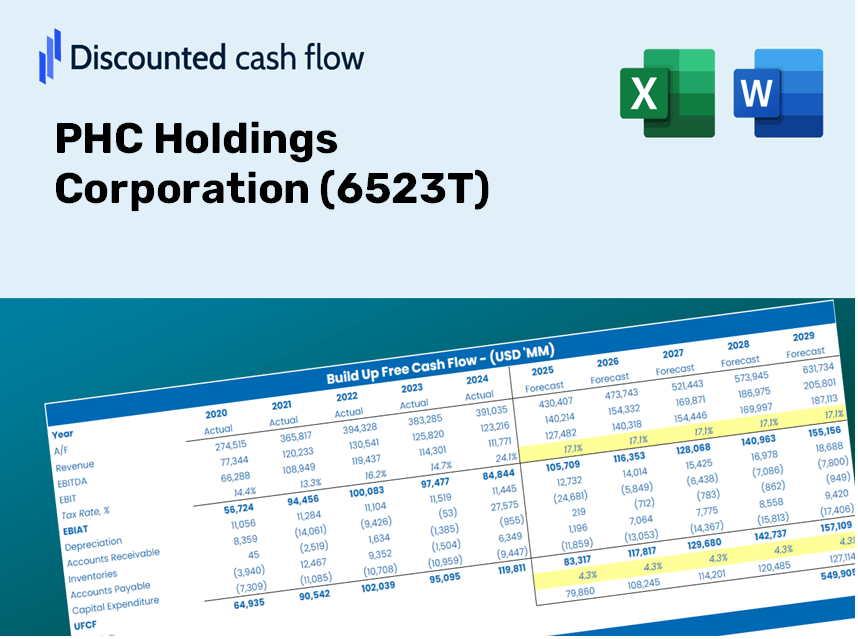
Gardez un aperçu de l'analyse de l'évaluation de votre SHC Holdings Corporation (6523T) à l'aide de notre calculatrice sophistiquée DCF! Avec des données en temps réel pour (6523T), ce modèle Excel vous permet de personnaliser les prévisions et les hypothèses pour déterminer avec précision la valeur intrinsèque de PHC Holdings Corporation.
Discounted Cash Flow (DCF) - (USD MM)
| Year | AY1 2020 |
AY2 2021 |
AY3 2022 |
AY4 2023 |
AY5 2024 |
FY1 2025 |
FY2 2026 |
FY3 2027 |
FY4 2028 |
FY5 2029 |
|---|---|---|---|---|---|---|---|---|---|---|
| Revenue | 306,071.0 | 340,452.0 | 356,434.0 | 353,900.0 | 361,593.0 | 400,604.0 | 443,823.8 | 491,706.4 | 544,754.8 | 603,526.5 |
| Revenue Growth, % | 0 | 11.23 | 4.69 | -0.71093 | 2.17 | 10.79 | 10.79 | 10.79 | 10.79 | 10.79 |
| EBITDA | 62,292.0 | 37,558.0 | 36,755.0 | 30,148.0 | 52,327.0 | 51,826.8 | 57,418.2 | 63,612.9 | 70,475.9 | 78,079.2 |
| EBITDA, % | 20.35 | 11.03 | 10.31 | 8.52 | 14.47 | 12.94 | 12.94 | 12.94 | 12.94 | 12.94 |
| Depreciation | 30,371.0 | 31,077.0 | 29,015.0 | 27,933.0 | 27,871.0 | 34,285.4 | 37,984.3 | 42,082.3 | 46,622.4 | 51,652.4 |
| Depreciation, % | 9.92 | 9.13 | 8.14 | 7.89 | 7.71 | 8.56 | 8.56 | 8.56 | 8.56 | 8.56 |
| EBIT | 31,921.0 | 6,481.0 | 7,740.0 | 2,215.0 | 24,456.0 | 17,541.4 | 19,433.9 | 21,530.6 | 23,853.4 | 26,426.9 |
| EBIT, % | 10.43 | 1.9 | 2.17 | 0.62588 | 6.76 | 4.38 | 4.38 | 4.38 | 4.38 | 4.38 |
| Total Cash | 63,964.0 | 97,625.0 | 63,254.0 | 51,819.0 | 39,592.0 | 74,441.4 | 82,472.6 | 91,370.3 | 101,228.0 | 112,149.1 |
| Total Cash, percent | .0 | .0 | .0 | .0 | .0 | .0 | .0 | .0 | .0 | .0 |
| Account Receivables | 63,470.0 | 63,727.0 | 69,280.0 | 73,802.0 | 70,530.0 | 79,521.2 | 88,100.5 | 97,605.3 | 108,135.6 | 119,802.0 |
| Account Receivables, % | 20.74 | 18.72 | 19.44 | 20.85 | 19.51 | 19.85 | 19.85 | 19.85 | 19.85 | 19.85 |
| Inventories | 38,829.0 | 44,509.0 | 51,732.0 | 52,651.0 | 51,694.0 | 55,641.6 | 61,644.5 | 68,295.2 | 75,663.3 | 83,826.3 |
| Inventories, % | 12.69 | 13.07 | 14.51 | 14.88 | 14.3 | 13.89 | 13.89 | 13.89 | 13.89 | 13.89 |
| Accounts Payable | 69,268.0 | 68,802.0 | 65,639.0 | 69,881.0 | 65,665.0 | 79,449.2 | 88,020.7 | 97,516.9 | 108,037.7 | 119,693.5 |
| Accounts Payable, % | 22.63 | 20.21 | 18.42 | 19.75 | 18.16 | 19.83 | 19.83 | 19.83 | 19.83 | 19.83 |
| Capital Expenditure | -12,154.0 | -11,736.0 | -11,516.0 | -14,630.0 | -11,610.0 | -14,416.8 | -15,972.1 | -17,695.3 | -19,604.4 | -21,719.4 |
| Capital Expenditure, % | -3.97 | -3.45 | -3.23 | -4.13 | -3.21 | -3.6 | -3.6 | -3.6 | -3.6 | -3.6 |
| Tax Rate, % | 45.38 | 45.38 | 45.38 | 45.38 | 45.38 | 45.38 | 45.38 | 45.38 | 45.38 | 45.38 |
| EBITAT | 23,681.6 | -18,264.2 | -139,276.8 | 2,155.3 | 13,358.2 | 7,932.8 | 8,788.6 | 9,736.8 | 10,787.2 | 11,951.0 |
| Depreciation | ||||||||||
| Changes in Account Receivables | ||||||||||
| Changes in Inventories | ||||||||||
| Changes in Accounts Payable | ||||||||||
| Capital Expenditure | ||||||||||
| UFCF | 8,867.6 | -5,326.2 | -137,716.8 | 14,259.3 | 29,632.2 | 28,646.8 | 24,790.0 | 27,464.5 | 30,427.6 | 33,710.3 |
| WACC, % | 4.27 | 2.4 | 2.4 | 4.85 | 3.77 | 3.54 | 3.54 | 3.54 | 3.54 | 3.54 |
| PV UFCF | ||||||||||
| SUM PV UFCF | 130,343.1 | |||||||||
| Long Term Growth Rate, % | 3.00 | |||||||||
| Free cash flow (T + 1) | 34,722 | |||||||||
| Terminal Value | 6,447,894 | |||||||||
| Present Terminal Value | 5,418,869 | |||||||||
| Enterprise Value | 5,549,212 | |||||||||
| Net Debt | 215,668 | |||||||||
| Equity Value | 5,333,544 | |||||||||
| Diluted Shares Outstanding, MM | 127 | |||||||||
| Equity Value Per Share | 42,006.99 |
What You Will Receive
- Pre-Filled Financial Model: Utilizes PHC Holdings Corporation’s (6523T) actual data for accurate DCF valuation.
- Complete Forecast Control: Modify revenue growth, profit margins, WACC, and other essential variables.
- Immediate Calculations: Real-time updates provide instant results as you adjust inputs.
- Investor-Ready Template: A polished Excel file crafted for high-quality valuation presentations.
- Adaptable and Reusable: Designed for versatility, making it easy to generate detailed forecasts repeatedly.
Key Features
- Comprehensive DCF Calculator: Offers detailed unlevered and levered DCF valuation models tailored for PHC Holdings Corporation (6523T).
- WACC Tool: Pre-configured Weighted Average Cost of Capital sheet with adjustable inputs for accurate assessments.
- Customizable Forecast Parameters: Easily alter growth projections, capital expenditures, and discount rates as needed.
- Integrated Financial Ratios: Evaluate profitability, leverage, and efficiency ratios specific to PHC Holdings Corporation (6523T).
- Interactive Dashboard and Visualizations: Graphical representations provide a clear summary of essential valuation metrics for efficient analysis.
How It Functions
- Step 1: Download the prebuilt Excel template featuring PHC Holdings Corporation (6523T) data.
- Step 2: Review the pre-filled sheets to familiarize yourself with the essential metrics.
- Step 3: Modify forecasts and assumptions in the editable yellow cells (WACC, growth, margins).
- Step 4: Instantly view the updated results, including the intrinsic value of PHC Holdings Corporation (6523T).
- Step 5: Use the outputs to make informed investment decisions or to generate detailed reports.
Why Choose This Calculator for PHC Holdings Corporation (6523T)?
- Accurate Data: Leverage real financials from PHC Holdings Corporation for trustworthy valuation outcomes.
- Customizable: Modify essential parameters such as growth rates, WACC, and tax rates to align with your forecasts.
- Time-Saving: Built-in calculations allow you to skip the tedious groundwork.
- Professional-Grade Tool: Tailored for investors, analysts, and consultants focused on PHC Holdings Corporation.
- User-Friendly: With an intuitive design and easy-to-follow instructions, it's accessible for all users.
Who Can Benefit from This Product?
- Finance Students: Master valuation methods and put them into practice with real-world data.
- Academics: Integrate industry-standard models into your research or teaching materials.
- Investors: Evaluate your investment strategies and assess valuation results for PHC Holdings Corporation (6523T).
- Analysts: Enhance your efficiency with a ready-to-use, customizable DCF model.
- Small Business Owners: Discover how large public companies, such as PHC Holdings Corporation (6523T), are evaluated in the market.
Overview of the Template Features
- Preloaded PHC Holdings Data: Historical and forecasted financial metrics, including revenue, EBIT, and capital expenditures.
- DCF and WACC Models: Professional-grade sheets for determining intrinsic value and Weighted Average Cost of Capital.
- Editable Inputs: Yellow-highlighted cells for customizing revenue growth, tax rates, and discount rates.
- Financial Statements: Detailed annual and quarterly financial reports for in-depth analysis.
- Key Ratios: Profitability, leverage, and efficiency ratios to assess performance.
- Dashboard and Charts: Visual presentations of valuation results and underlying assumptions.
Disclaimer
All information, articles, and product details provided on this website are for general informational and educational purposes only. We do not claim any ownership over, nor do we intend to infringe upon, any trademarks, copyrights, logos, brand names, or other intellectual property mentioned or depicted on this site. Such intellectual property remains the property of its respective owners, and any references here are made solely for identification or informational purposes, without implying any affiliation, endorsement, or partnership.
We make no representations or warranties, express or implied, regarding the accuracy, completeness, or suitability of any content or products presented. Nothing on this website should be construed as legal, tax, investment, financial, medical, or other professional advice. In addition, no part of this site—including articles or product references—constitutes a solicitation, recommendation, endorsement, advertisement, or offer to buy or sell any securities, franchises, or other financial instruments, particularly in jurisdictions where such activity would be unlawful.
All content is of a general nature and may not address the specific circumstances of any individual or entity. It is not a substitute for professional advice or services. Any actions you take based on the information provided here are strictly at your own risk. You accept full responsibility for any decisions or outcomes arising from your use of this website and agree to release us from any liability in connection with your use of, or reliance upon, the content or products found herein.