
|
MCJ Co., Ltd. (6670.T) Évaluation DCF |
Entièrement Modifiable: Adapté À Vos Besoins Dans Excel Ou Sheets
Conception Professionnelle: Modèles Fiables Et Conformes Aux Normes Du Secteur
Pré-Construits Pour Une Utilisation Rapide Et Efficace
Compatible MAC/PC, entièrement débloqué
Aucune Expertise N'Est Requise; Facile À Suivre
MCJ Co., Ltd. (6670.T) Bundle
Explorez le potentiel financier de MCJ Co., Ltd. (6670T) avec notre calculatrice DCF conviviale! Entrez vos projections pour la croissance, les marges et les dépenses pour calculer la valeur intrinsèque de MCJ Co., Ltd. (6670T) et affinez votre approche d'investissement.
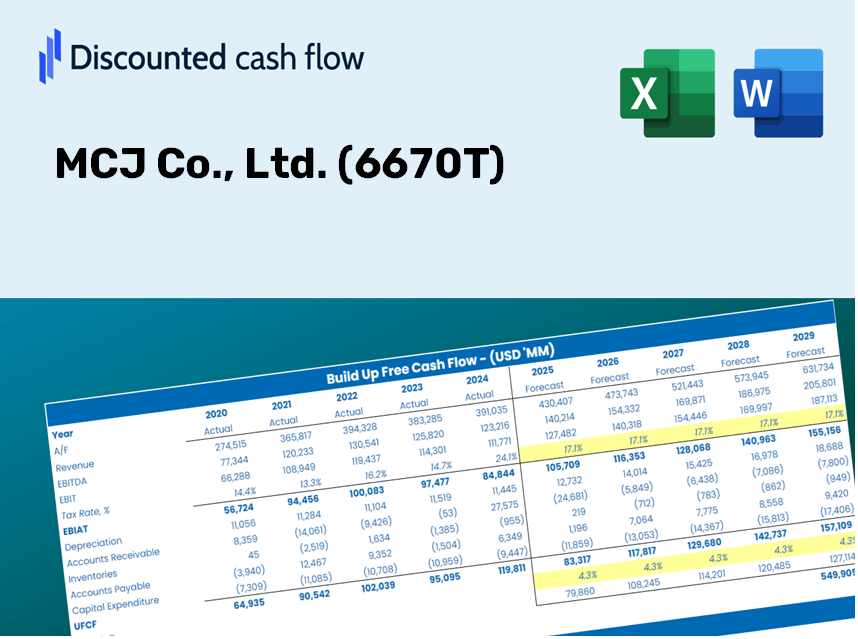
Discounted Cash Flow (DCF) - (USD MM)
| Year | AY1 2020 |
AY2 2021 |
AY3 2022 |
AY4 2023 |
AY5 2024 |
FY1 2025 |
FY2 2026 |
FY3 2027 |
FY4 2028 |
FY5 2029 |
|---|---|---|---|---|---|---|---|---|---|---|
| Revenue | 174,173.0 | 191,247.0 | 191,076.0 | 187,455.0 | 207,171.0 | 216,667.8 | 226,599.9 | 236,987.4 | 247,850.9 | 259,212.5 |
| Revenue Growth, % | 0 | 9.8 | -0.08941317 | -1.9 | 10.52 | 4.58 | 4.58 | 4.58 | 4.58 | 4.58 |
| EBITDA | 16,365.0 | 14,495.0 | 14,941.0 | 18,585.0 | 21,322.0 | 19,500.4 | 20,394.4 | 21,329.2 | 22,307.0 | 23,329.5 |
| EBITDA, % | 9.4 | 7.58 | 7.82 | 9.91 | 10.29 | 9 | 9 | 9 | 9 | 9 |
| Depreciation | 931.0 | 920.0 | 989.0 | 1,197.0 | 1,308.0 | 1,214.7 | 1,270.4 | 1,328.6 | 1,389.5 | 1,453.2 |
| Depreciation, % | 0.53453 | 0.48105 | 0.5176 | 0.63855 | 0.63136 | 0.56062 | 0.56062 | 0.56062 | 0.56062 | 0.56062 |
| EBIT | 15,434.0 | 13,575.0 | 13,952.0 | 17,388.0 | 20,014.0 | 18,285.8 | 19,124.0 | 20,000.6 | 20,917.5 | 21,876.3 |
| EBIT, % | 8.86 | 7.1 | 7.3 | 9.28 | 9.66 | 8.44 | 8.44 | 8.44 | 8.44 | 8.44 |
| Total Cash | 31,811.0 | 24,565.0 | 41,143.0 | 48,522.0 | 57,725.0 | 46,102.1 | 48,215.5 | 50,425.7 | 52,737.2 | 55,154.7 |
| Total Cash, percent | .0 | .0 | .0 | .0 | .0 | .0 | .0 | .0 | .0 | .0 |
| Account Receivables | 16,953.0 | 20,688.0 | 19,970.0 | 22,790.0 | 22,317.0 | 23,370.7 | 24,442.0 | 25,562.4 | 26,734.2 | 27,959.7 |
| Account Receivables, % | 9.73 | 10.82 | 10.45 | 12.16 | 10.77 | 10.79 | 10.79 | 10.79 | 10.79 | 10.79 |
| Inventories | 26,061.0 | 36,404.0 | 26,060.0 | 30,664.0 | 35,431.0 | 35,142.1 | 36,753.0 | 38,437.8 | 40,199.8 | 42,042.6 |
| Inventories, % | 14.96 | 19.04 | 13.64 | 16.36 | 17.1 | 16.22 | 16.22 | 16.22 | 16.22 | 16.22 |
| Accounts Payable | 12,418.0 | 10,465.0 | 9,548.0 | 11,537.0 | 14,065.0 | 13,235.0 | 13,841.7 | 14,476.3 | 15,139.9 | 15,833.9 |
| Accounts Payable, % | 7.13 | 5.47 | 5 | 6.15 | 6.79 | 6.11 | 6.11 | 6.11 | 6.11 | 6.11 |
| Capital Expenditure | -1,880.0 | -1,228.0 | -2,684.0 | -3,162.0 | -1,505.0 | -2,400.4 | -2,510.5 | -2,625.5 | -2,745.9 | -2,871.8 |
| Capital Expenditure, % | -1.08 | -0.6421 | -1.4 | -1.69 | -0.72645 | -1.11 | -1.11 | -1.11 | -1.11 | -1.11 |
| Tax Rate, % | 28.62 | 28.62 | 28.62 | 28.62 | 28.62 | 28.62 | 28.62 | 28.62 | 28.62 | 28.62 |
| EBITAT | 10,055.2 | 9,327.0 | 9,661.9 | 12,400.8 | 14,286.4 | 12,646.7 | 13,226.4 | 13,832.8 | 14,466.8 | 15,130.0 |
| Depreciation | ||||||||||
| Changes in Account Receivables | ||||||||||
| Changes in Inventories | ||||||||||
| Changes in Accounts Payable | ||||||||||
| Capital Expenditure | ||||||||||
| UFCF | -21,489.8 | -7,012.0 | 18,111.9 | 5,000.8 | 12,323.4 | 9,866.3 | 9,910.8 | 10,365.1 | 10,840.2 | 11,337.2 |
| WACC, % | 5.01 | 5.02 | 5.03 | 5.03 | 5.03 | 5.03 | 5.03 | 5.03 | 5.03 | 5.03 |
| PV UFCF | ||||||||||
| SUM PV UFCF | 45,107.5 | |||||||||
| Long Term Growth Rate, % | 0.50 | |||||||||
| Free cash flow (T + 1) | 11,394 | |||||||||
| Terminal Value | 251,739 | |||||||||
| Present Terminal Value | 196,999 | |||||||||
| Enterprise Value | 242,107 | |||||||||
| Net Debt | -44,282 | |||||||||
| Equity Value | 286,389 | |||||||||
| Diluted Shares Outstanding, MM | 98 | |||||||||
| Equity Value Per Share | 2,915.74 |
What You Will Receive
- Comprehensive Financial Model: MCJ Co., Ltd.’s actual performance data facilitates accurate DCF valuation.
- Complete Forecasting Power: Modify revenue growth, profit margins, WACC, and other essential factors.
- Real-Time Calculations: Automatic updates provide immediate feedback as you adjust inputs.
- Professional-Grade Template: An optimized Excel file crafted for high-quality valuation presentations.
- Flexible and Reusable: Designed for adaptability, enabling multiple uses for in-depth forecasts.
Key Features
- 🔍 Real-Life MCJ Co., Ltd. Financials: Access pre-filled historical and projected data for MCJ Co., Ltd. (6670T).
- ✏️ Fully Customizable Inputs: Modify all essential parameters (yellow cells), including WACC, growth %, and tax rates.
- 📊 Professional DCF Valuation: Utilize built-in formulas to determine MCJ Co., Ltd.'s intrinsic value through the Discounted Cash Flow method.
- ⚡ Instant Results: See MCJ Co., Ltd.'s valuation update immediately after adjustments.
- Scenario Analysis: Evaluate and compare outcomes for different financial assumptions side-by-side.
How It Works
- Step 1: Download the Excel file.
- Step 2: Examine MCJ Co., Ltd.'s pre-filled financial data and forecasts.
- Step 3: Adjust key inputs such as revenue growth, WACC, and tax rates (highlighted cells).
- Step 4: Observe the DCF model update in real-time as you modify your assumptions.
- Step 5: Review the results and utilize them for your investment decisions.
Why Choose the MCJ Co., Ltd. (6670T) Calculator?
- Designed for Experts: A sophisticated tool tailored for analysts, CFOs, and consultants.
- Accurate Financial Data: MCJ Co., Ltd.'s historical and projected financials are preloaded for precision.
- Sophisticated Scenario Analysis: Effortlessly simulate various forecasts and assumptions.
- Transparent Results: Automatically computes intrinsic value, NPV, and other essential metrics.
- User-Friendly: Stepwise guidance ensures a seamless experience throughout the process.
Who Should Benefit from MCJ Co., Ltd. (6670T)?
- Investors: Assess the fair value of MCJ Co., Ltd. (6670T) to make informed investment choices.
- CFOs: Utilize a high-quality DCF model for accurate financial reporting and analysis.
- Consultants: Efficiently customize the template for client valuation reports.
- Entrepreneurs: Learn from the financial modeling practices of successful corporations.
- Educators: Employ this resource as a teaching aid for explaining valuation techniques.
What the Template Includes
- Preloaded MCJ Co., Ltd. (6670T) Data: Historical and projected financial metrics, encompassing revenue, EBIT, and capital expenditures.
- DCF and WACC Models: High-quality spreadsheets designed to calculate intrinsic value and Weighted Average Cost of Capital.
- Customizable Inputs: Cells highlighted in yellow for modifying revenue growth, tax rates, and discount rates.
- Financial Statements: Detailed annual and quarterly financial reports for thorough analysis.
- Key Ratios: Measures of profitability, leverage, and efficiency for performance assessment.
- Dashboard and Visualizations: Graphical representations of valuation results and underlying assumptions.
Disclaimer
All information, articles, and product details provided on this website are for general informational and educational purposes only. We do not claim any ownership over, nor do we intend to infringe upon, any trademarks, copyrights, logos, brand names, or other intellectual property mentioned or depicted on this site. Such intellectual property remains the property of its respective owners, and any references here are made solely for identification or informational purposes, without implying any affiliation, endorsement, or partnership.
We make no representations or warranties, express or implied, regarding the accuracy, completeness, or suitability of any content or products presented. Nothing on this website should be construed as legal, tax, investment, financial, medical, or other professional advice. In addition, no part of this site—including articles or product references—constitutes a solicitation, recommendation, endorsement, advertisement, or offer to buy or sell any securities, franchises, or other financial instruments, particularly in jurisdictions where such activity would be unlawful.
All content is of a general nature and may not address the specific circumstances of any individual or entity. It is not a substitute for professional advice or services. Any actions you take based on the information provided here are strictly at your own risk. You accept full responsibility for any decisions or outcomes arising from your use of this website and agree to release us from any liability in connection with your use of, or reliance upon, the content or products found herein.