
|
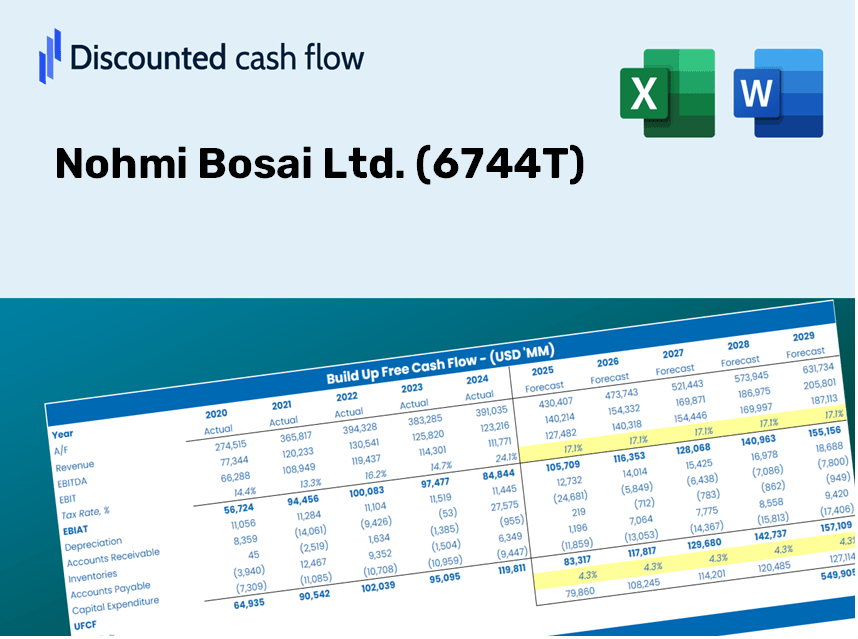
Nohmi Bosai Ltd. (6744.T) Évaluation DCF |
Entièrement Modifiable: Adapté À Vos Besoins Dans Excel Ou Sheets
Conception Professionnelle: Modèles Fiables Et Conformes Aux Normes Du Secteur
Pré-Construits Pour Une Utilisation Rapide Et Efficace
Compatible MAC/PC, entièrement débloqué
Aucune Expertise N'Est Requise; Facile À Suivre
Nohmi Bosai Ltd. (6744.T) Bundle
Améliorez votre stratégie d'investissement avec la calculatrice DCF NOHMI BOSAI LTD. (6744T)! Accédez à des données financières précises, ajustez les projections et dépenses de croissance et observez instantanément comment ces modifications affectent la valeur intrinsèque de Nohmi Bosai Ltd. (6744T).
Discounted Cash Flow (DCF) - (USD MM)
| Year | AY1 2020 |
AY2 2021 |
AY3 2022 |
AY4 2023 |
AY5 2024 |
FY1 2025 |
FY2 2026 |
FY3 2027 |
FY4 2028 |
FY5 2029 |
|---|---|---|---|---|---|---|---|---|---|---|
| Revenue | 107,897.0 | 112,913.0 | 105,537.0 | 118,506.0 | 133,696.0 | 141,458.0 | 149,670.7 | 158,360.2 | 167,554.1 | 177,281.9 |
| Revenue Growth, % | 0 | 4.65 | -6.53 | 12.29 | 12.82 | 5.81 | 5.81 | 5.81 | 5.81 | 5.81 |
| EBITDA | 13,344.0 | 14,978.0 | 12,681.0 | 14,158.0 | 18,659.0 | 17,979.7 | 19,023.6 | 20,128.0 | 21,296.6 | 22,533.1 |
| EBITDA, % | 12.37 | 13.27 | 12.02 | 11.95 | 13.96 | 12.71 | 12.71 | 12.71 | 12.71 | 12.71 |
| Depreciation | 2,219.0 | 2,344.0 | 2,465.0 | 2,494.0 | 2,582.0 | 2,971.7 | 3,144.3 | 3,326.8 | 3,520.0 | 3,724.3 |
| Depreciation, % | 2.06 | 2.08 | 2.34 | 2.1 | 1.93 | 2.1 | 2.1 | 2.1 | 2.1 | 2.1 |
| EBIT | 11,125.0 | 12,634.0 | 10,216.0 | 11,664.0 | 16,077.0 | 15,008.0 | 15,879.3 | 16,801.2 | 17,776.7 | 18,808.7 |
| EBIT, % | 10.31 | 11.19 | 9.68 | 9.84 | 12.03 | 10.61 | 10.61 | 10.61 | 10.61 | 10.61 |
| Total Cash | 52,049.0 | 48,663.0 | 48,805.0 | 46,550.0 | 47,408.0 | 60,069.3 | 63,556.8 | 67,246.7 | 71,150.9 | 75,281.7 |
| Total Cash, percent | .0 | .0 | .0 | .0 | .0 | .0 | .0 | .0 | .0 | .0 |
| Account Receivables | 37,163.0 | 48,451.0 | 45,955.0 | 48,502.0 | 54,730.0 | 57,364.4 | 60,694.8 | 64,218.6 | 67,946.9 | 71,891.7 |
| Account Receivables, % | 34.44 | 42.91 | 43.54 | 40.93 | 40.94 | 40.55 | 40.55 | 40.55 | 40.55 | 40.55 |
| Inventories | 11,949.0 | 9,243.0 | 12,478.0 | 15,246.0 | 13,838.0 | 15,362.1 | 16,254.0 | 17,197.7 | 18,196.1 | 19,252.5 |
| Inventories, % | 11.07 | 8.19 | 11.82 | 12.87 | 10.35 | 10.86 | 10.86 | 10.86 | 10.86 | 10.86 |
| Accounts Payable | 4,799.0 | 4,359.0 | 4,305.0 | 4,430.0 | 4,830.0 | 5,584.3 | 5,908.5 | 6,251.5 | 6,614.5 | 6,998.5 |
| Accounts Payable, % | 4.45 | 3.86 | 4.08 | 3.74 | 3.61 | 3.95 | 3.95 | 3.95 | 3.95 | 3.95 |
| Capital Expenditure | -4,228.0 | -4,194.0 | -3,025.0 | -2,486.0 | -2,238.0 | -4,037.5 | -4,271.9 | -4,519.9 | -4,782.3 | -5,060.0 |
| Capital Expenditure, % | -3.92 | -3.71 | -2.87 | -2.1 | -1.67 | -2.85 | -2.85 | -2.85 | -2.85 | -2.85 |
| Tax Rate, % | 30.87 | 30.87 | 30.87 | 30.87 | 30.87 | 30.87 | 30.87 | 30.87 | 30.87 | 30.87 |
| EBITAT | 7,629.6 | 8,980.7 | 7,030.3 | 8,155.2 | 11,113.9 | 10,431.4 | 11,037.0 | 11,677.8 | 12,355.7 | 13,073.1 |
| Depreciation | ||||||||||
| Changes in Account Receivables | ||||||||||
| Changes in Inventories | ||||||||||
| Changes in Accounts Payable | ||||||||||
| Capital Expenditure | ||||||||||
| UFCF | -38,692.4 | -1,891.3 | 5,677.3 | 2,973.2 | 7,037.9 | 5,961.4 | 6,011.3 | 6,360.3 | 6,729.5 | 7,120.2 |
| WACC, % | 4.66 | 4.66 | 4.66 | 4.66 | 4.66 | 4.66 | 4.66 | 4.66 | 4.66 | 4.66 |
| PV UFCF | ||||||||||
| SUM PV UFCF | 28,013.0 | |||||||||
| Long Term Growth Rate, % | 1.00 | |||||||||
| Free cash flow (T + 1) | 7,191 | |||||||||
| Terminal Value | 196,644 | |||||||||
| Present Terminal Value | 156,616 | |||||||||
| Enterprise Value | 184,629 | |||||||||
| Net Debt | -43,258 | |||||||||
| Equity Value | 227,887 | |||||||||
| Diluted Shares Outstanding, MM | 59 | |||||||||
| Equity Value Per Share | 3,857.24 |
What You Will Receive
- Authentic Nohmi Bosai Financial Data: Pre-loaded with Nohmi Bosai’s historical and projected figures for accurate analysis.
- Completely Customizable Template: Easily adjust critical inputs such as revenue growth, WACC, and EBITDA percentages.
- Instant Calculations: Watch as Nohmi Bosai’s intrinsic value updates in real-time with your modifications.
- Expert Valuation Tool: Tailored for investors, analysts, and consultants aiming for precise DCF outcomes.
- Intuitive User Interface: Streamlined layout and clear guidance suitable for users of all skill levels.
Key Features
- Real-Time Nohmi Bosai Data: Comes pre-loaded with historical financial figures and projections for Nohmi Bosai Ltd. (6744T).
- Fully Adjustable Parameters: Modify revenue growth rates, profit margins, WACC, tax rates, and capital expenditures as needed.
- Dynamic Valuation Framework: Automatically refreshes Net Present Value (NPV) and intrinsic value based on your customized inputs.
- Scenario Analysis: Generate various forecasting scenarios to evaluate different valuation results.
- Intuitive Interface: Designed for both seasoned professionals and newcomers, featuring a clear and organized layout.
How It Operates
- Download the Template: Gain immediate access to the Excel-based Nohmi Bosai Ltd. DCF Calculator.
- Input Your Assumptions: Modify the yellow-highlighted cells for growth rates, WACC, margins, and more.
- Instant Calculations: The model automatically recalculates the intrinsic value of Nohmi Bosai Ltd. (6744T).
- Test Scenarios: Explore various assumptions to assess how valuations might shift.
- Analyze and Decide: Utilize the findings to inform your investment or financial decisions.
Why Choose Nohmi Bosai Ltd. (6744T) Calculator?
- User-Friendly Interface: Perfectly tailored for both novices and seasoned users.
- Customizable Inputs: Adjust variables effortlessly to suit your specific analysis needs.
- Real-Time Feedback: Watch Nohmi Bosai Ltd.’s valuation update instantly as you make changes.
- Pre-Loaded Data: Comes equipped with Nohmi Bosai Ltd.’s latest financial information for immediate assessments.
- Relied Upon by Experts: A preferred tool for investors and analysts seeking to make strategic decisions.
Who Can Benefit from Nohmi Bosai Ltd. (6744T)?
- Investors: Make informed decisions backed by reliable insights from a leading safety solutions provider.
- Financial Analysts: Streamline your analysis with customizable reports tailored for Nohmi Bosai Ltd. (6744T).
- Consultants: Effortlessly modify presentations and reports to showcase Nohmi Bosai Ltd. (6744T) to your clients.
- Safety Professionals: Enhance your knowledge of safety systems by exploring real-world applications from Nohmi Bosai Ltd. (6744T).
- Educators and Students: Utilize it as a hands-on resource in courses related to safety management and engineering.
Contents of the Template
- Pre-Filled DCF Model: Nohmi Bosai Ltd.'s (6744T) financial data preloaded for immediate use.
- WACC Calculator: Comprehensive calculations for Weighted Average Cost of Capital.
- Financial Ratios: Assess Nohmi Bosai Ltd.'s (6744T) profitability, leverage, and efficiency.
- Editable Inputs: Modify assumptions such as growth rates, margins, and CAPEX to suit your analysis.
- Financial Statements: Access annual and quarterly reports for in-depth examination.
- Interactive Dashboard: Visualize key valuation metrics and outcomes with ease.
Disclaimer
All information, articles, and product details provided on this website are for general informational and educational purposes only. We do not claim any ownership over, nor do we intend to infringe upon, any trademarks, copyrights, logos, brand names, or other intellectual property mentioned or depicted on this site. Such intellectual property remains the property of its respective owners, and any references here are made solely for identification or informational purposes, without implying any affiliation, endorsement, or partnership.
We make no representations or warranties, express or implied, regarding the accuracy, completeness, or suitability of any content or products presented. Nothing on this website should be construed as legal, tax, investment, financial, medical, or other professional advice. In addition, no part of this site—including articles or product references—constitutes a solicitation, recommendation, endorsement, advertisement, or offer to buy or sell any securities, franchises, or other financial instruments, particularly in jurisdictions where such activity would be unlawful.
All content is of a general nature and may not address the specific circumstances of any individual or entity. It is not a substitute for professional advice or services. Any actions you take based on the information provided here are strictly at your own risk. You accept full responsibility for any decisions or outcomes arising from your use of this website and agree to release us from any liability in connection with your use of, or reliance upon, the content or products found herein.