
|
Elecom Co., Ltd. (6750.T) Évaluation DCF |
Entièrement Modifiable: Adapté À Vos Besoins Dans Excel Ou Sheets
Conception Professionnelle: Modèles Fiables Et Conformes Aux Normes Du Secteur
Pré-Construits Pour Une Utilisation Rapide Et Efficace
Compatible MAC/PC, entièrement débloqué
Aucune Expertise N'Est Requise; Facile À Suivre
Elecom Co., Ltd. (6750.T) Bundle
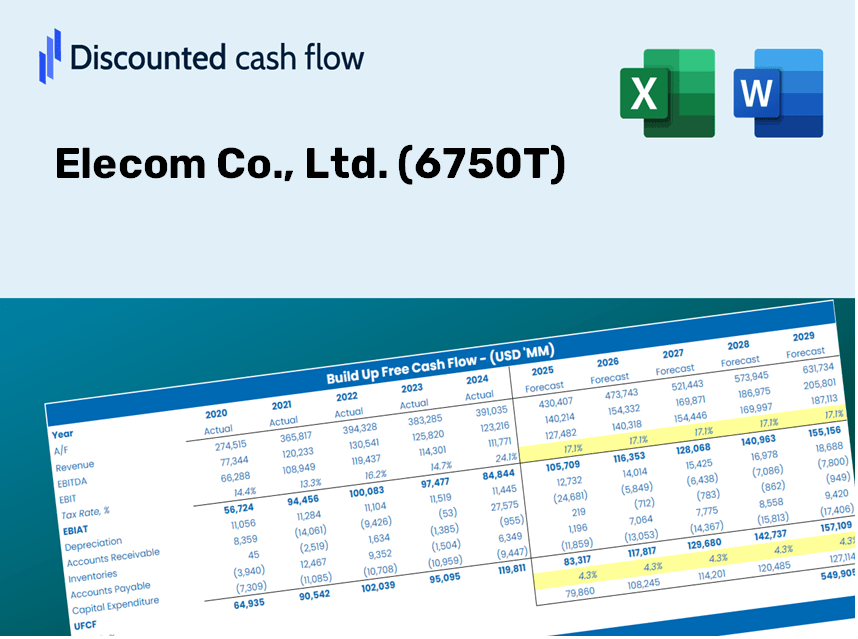
Optimisez votre temps et améliorez la précision avec notre (6750T) Calculator DCF! Équipée des données réelles Elecom Co., Ltd. et des hypothèses personnalisables, cet outil vous permet de prévoir, d'analyser et d'évaluer Elecom Co., Ltd. comme un investisseur chevronné.
Discounted Cash Flow (DCF) - (USD MM)
| Year | AY1 2020 |
AY2 2021 |
AY3 2022 |
AY4 2023 |
AY5 2024 |
FY1 2025 |
FY2 2026 |
FY3 2027 |
FY4 2028 |
FY5 2029 |
|---|---|---|---|---|---|---|---|---|---|---|
| Revenue | 108,040.0 | 107,358.0 | 103,727.0 | 110,169.0 | 118,007.0 | 120,754.1 | 123,565.2 | 126,441.7 | 129,385.1 | 132,397.1 |
| Revenue Growth, % | 0 | -0.63125 | -3.38 | 6.21 | 7.11 | 2.33 | 2.33 | 2.33 | 2.33 | 2.33 |
| EBITDA | 18,045.0 | 16,114.0 | 14,208.0 | 16,774.0 | 16,784.0 | 18,078.8 | 18,499.6 | 18,930.3 | 19,371.0 | 19,821.9 |
| EBITDA, % | 16.7 | 15.01 | 13.7 | 15.23 | 14.22 | 14.97 | 14.97 | 14.97 | 14.97 | 14.97 |
| Depreciation | 2,102.0 | 2,078.0 | 2,762.0 | 3,276.0 | 3,816.0 | 3,079.5 | 3,151.2 | 3,224.6 | 3,299.6 | 3,376.5 |
| Depreciation, % | 1.95 | 1.94 | 2.66 | 2.97 | 3.23 | 2.55 | 2.55 | 2.55 | 2.55 | 2.55 |
| EBIT | 15,943.0 | 14,036.0 | 11,446.0 | 13,498.0 | 12,968.0 | 14,999.3 | 15,348.4 | 15,705.7 | 16,071.3 | 16,445.5 |
| EBIT, % | 14.76 | 13.07 | 11.03 | 12.25 | 10.99 | 12.42 | 12.42 | 12.42 | 12.42 | 12.42 |
| Total Cash | 61,403.0 | 54,462.0 | 55,113.0 | 52,355.0 | 54,917.0 | 61,525.5 | 62,957.7 | 64,423.3 | 65,923.1 | 67,457.7 |
| Total Cash, percent | .0 | .0 | .0 | .0 | .0 | .0 | .0 | .0 | .0 | .0 |
| Account Receivables | 20,075.0 | 18,758.0 | 17,648.0 | 21,734.0 | 21,033.0 | 21,885.2 | 22,394.6 | 22,916.0 | 23,449.4 | 23,995.3 |
| Account Receivables, % | 18.58 | 17.47 | 17.01 | 19.73 | 17.82 | 18.12 | 18.12 | 18.12 | 18.12 | 18.12 |
| Inventories | 10,791.0 | 12,567.0 | 12,447.0 | 14,922.0 | 14,038.0 | 14,281.3 | 14,613.8 | 14,954.0 | 15,302.1 | 15,658.3 |
| Inventories, % | 9.99 | 11.71 | 12 | 13.54 | 11.9 | 11.83 | 11.83 | 11.83 | 11.83 | 11.83 |
| Accounts Payable | 16,903.0 | 17,130.0 | 13,771.0 | 17,361.0 | 17,117.0 | 18,147.1 | 18,569.6 | 19,001.9 | 19,444.2 | 19,896.9 |
| Accounts Payable, % | 15.65 | 15.96 | 13.28 | 15.76 | 14.51 | 15.03 | 15.03 | 15.03 | 15.03 | 15.03 |
| Capital Expenditure | -2,593.0 | -3,450.0 | -6,749.0 | -3,098.0 | -3,254.0 | -4,272.2 | -4,371.6 | -4,473.4 | -4,577.5 | -4,684.1 |
| Capital Expenditure, % | -2.4 | -3.21 | -6.51 | -2.81 | -2.76 | -3.54 | -3.54 | -3.54 | -3.54 | -3.54 |
| Tax Rate, % | 28.28 | 28.28 | 28.28 | 28.28 | 28.28 | 28.28 | 28.28 | 28.28 | 28.28 | 28.28 |
| EBITAT | 11,305.8 | 10,402.4 | 8,129.7 | 9,983.5 | 9,301.2 | 10,851.7 | 11,104.3 | 11,362.8 | 11,627.3 | 11,898.0 |
| Depreciation | ||||||||||
| Changes in Account Receivables | ||||||||||
| Changes in Inventories | ||||||||||
| Changes in Accounts Payable | ||||||||||
| Capital Expenditure | ||||||||||
| UFCF | -3,148.2 | 8,798.4 | 2,013.7 | 7,190.5 | 11,204.2 | 9,593.6 | 9,464.4 | 9,684.7 | 9,910.2 | 10,140.9 |
| WACC, % | 4.53 | 4.53 | 4.53 | 4.53 | 4.53 | 4.53 | 4.53 | 4.53 | 4.53 | 4.53 |
| PV UFCF | ||||||||||
| SUM PV UFCF | 42,749.2 | |||||||||
| Long Term Growth Rate, % | 2.00 | |||||||||
| Free cash flow (T + 1) | 10,344 | |||||||||
| Terminal Value | 409,306 | |||||||||
| Present Terminal Value | 328,022 | |||||||||
| Enterprise Value | 370,772 | |||||||||
| Net Debt | -43,218 | |||||||||
| Equity Value | 413,990 | |||||||||
| Diluted Shares Outstanding, MM | 78 | |||||||||
| Equity Value Per Share | 5,307.51 |
What You'll Receive
- Modifiable Forecast Inputs: Effortlessly adjust assumptions (growth %, margins, WACC) to explore various scenarios.
- Real-World Data: Elecom Co., Ltd.’s financial information pre-filled to kickstart your analysis.
- Automated DCF Outputs: The template computes Net Present Value (NPV) and intrinsic value for you.
- Customizable and Professional: A sleek Excel model that tailors to your valuation requirements.
- Designed for Analysts and Investors: Perfect for assessing projections, confirming strategies, and enhancing efficiency.
Key Features
- Pre-Loaded Data: Elecom Co., Ltd.'s historical financial statements and pre-filled forecasts.
- Fully Adjustable Inputs: Customize WACC, tax rates, revenue growth, and EBITDA margins.
- Instant Results: View Elecom's intrinsic value recalculating in real time.
- Clear Visual Outputs: Dashboard charts showcase valuation results and essential metrics.
- Built for Accuracy: A professional tool tailored for analysts, investors, and finance professionals.
How It Functions
- Download: Obtain the pre-configured Excel file featuring Elecom Co., Ltd.’s (6750T) financial data.
- Customize: Modify projections such as revenue growth, EBITDA percentage, and WACC.
- Real-Time Updates: Watch as the intrinsic value and NPV calculations refresh automatically.
- Explore Scenarios: Generate various projections and instantly compare the results.
- Make Informed Choices: Leverage the valuation findings to inform your investment strategies.
Why Choose This Calculator for Elecom Co., Ltd. (6750T)?
- User-Friendly Interface: Tailored for both novices and seasoned professionals.
- Customizable Inputs: Adjust parameters easily to match your specific analysis needs.
- Real-Time Valuation Updates: Instantly observe changes in Elecom’s valuation as you modify inputs.
- Pre-Loaded Data: Comes equipped with Elecom’s actual financial figures for immediate analysis.
- Widely Recognized: Trusted by investors and analysts for making sound financial decisions.
Who Can Benefit from Elecom Co., Ltd. (6750T)?
- Finance Students: Explore valuation techniques and apply them to real-world data from Elecom Co., Ltd. (6750T).
- Academics: Integrate professional financial models into your coursework or research related to Elecom Co., Ltd. (6750T).
- Investors: Evaluate your investment strategies and analyze valuation outcomes for Elecom Co., Ltd. (6750T).
- Analysts: Enhance your analytical processes with a customizable DCF model tailored for Elecom Co., Ltd. (6750T).
- Small Business Owners: Discover how large public companies like Elecom Co., Ltd. (6750T) are evaluated and analyzed in the market.
Contents of the Template
- Pre-Filled Data: Contains Elecom Co., Ltd.'s (6750T) historical financials and projections.
- Discounted Cash Flow Model: Editable DCF valuation model featuring automatic calculations.
- Weighted Average Cost of Capital (WACC): A specialized sheet for WACC calculations based on user-defined inputs.
- Key Financial Ratios: Evaluate Elecom Co., Ltd.'s (6750T) profitability, efficiency, and leverage.
- Customizable Inputs: Easily modify revenue growth, margins, and tax rates.
- Intuitive Dashboard: Visual representations and tables highlighting key valuation outcomes.
Disclaimer
All information, articles, and product details provided on this website are for general informational and educational purposes only. We do not claim any ownership over, nor do we intend to infringe upon, any trademarks, copyrights, logos, brand names, or other intellectual property mentioned or depicted on this site. Such intellectual property remains the property of its respective owners, and any references here are made solely for identification or informational purposes, without implying any affiliation, endorsement, or partnership.
We make no representations or warranties, express or implied, regarding the accuracy, completeness, or suitability of any content or products presented. Nothing on this website should be construed as legal, tax, investment, financial, medical, or other professional advice. In addition, no part of this site—including articles or product references—constitutes a solicitation, recommendation, endorsement, advertisement, or offer to buy or sell any securities, franchises, or other financial instruments, particularly in jurisdictions where such activity would be unlawful.
All content is of a general nature and may not address the specific circumstances of any individual or entity. It is not a substitute for professional advice or services. Any actions you take based on the information provided here are strictly at your own risk. You accept full responsibility for any decisions or outcomes arising from your use of this website and agree to release us from any liability in connection with your use of, or reliance upon, the content or products found herein.