
|
Panasonic Holdings Corporation (6752.T) Évaluation DCF |
Entièrement Modifiable: Adapté À Vos Besoins Dans Excel Ou Sheets
Conception Professionnelle: Modèles Fiables Et Conformes Aux Normes Du Secteur
Pré-Construits Pour Une Utilisation Rapide Et Efficace
Compatible MAC/PC, entièrement débloqué
Aucune Expertise N'Est Requise; Facile À Suivre
Panasonic Holdings Corporation (6752.T) Bundle
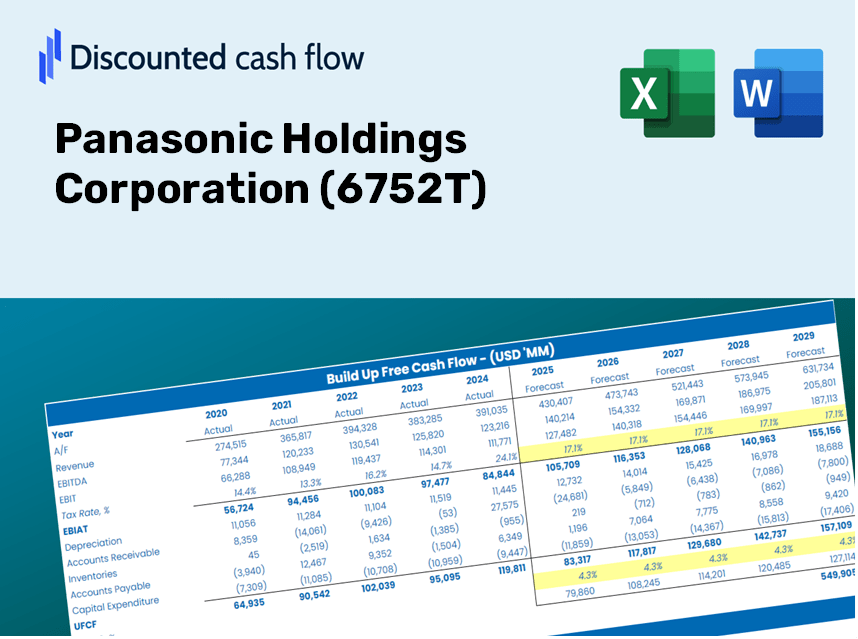
Simplifier la valorisation Panasonic Holdings Corporation (6752T) avec cette calculatrice DCF personnalisable! Doté de Real Panasonic Holdings Corporation (6752T) Financials and Adjustable Forecast Intarts, vous pouvez tester les scénarios et découvrir la juste valeur de Panasonic Holdings Corporation (6752T) en minutes.
Discounted Cash Flow (DCF) - (USD MM)
| Year | AY1 2021 |
AY2 2022 |
AY3 2023 |
AY4 2024 |
AY5 2025 |
FY1 2026 |
FY2 2027 |
FY3 2028 |
FY4 2029 |
FY5 2030 |
|---|---|---|---|---|---|---|---|---|---|---|
| Revenue | 6,698,794.0 | 7,388,791.0 | 8,378,942.0 | 8,496,420.0 | 8,458,185.0 | 8,979,485.9 | 9,532,915.9 | 10,120,455.3 | 10,744,206.4 | 11,406,400.9 |
| Revenue Growth, % | 0 | 10.3 | 13.4 | 1.4 | -0.45001 | 6.16 | 6.16 | 6.16 | 6.16 | 6.16 |
| EBITDA | 597,018.0 | 652,756.0 | 718,309.0 | 845,500.0 | 920,744.0 | 846,884.1 | 899,079.9 | 954,492.6 | 1,013,320.5 | 1,075,774.2 |
| EBITDA, % | 8.91 | 8.83 | 8.57 | 9.95 | 10.89 | 9.43 | 9.43 | 9.43 | 9.43 | 9.43 |
| Depreciation | 317,572.0 | 339,148.0 | 382,289.0 | 399,984.0 | 405,729.0 | 420,200.8 | 446,098.9 | 473,593.2 | 502,782.1 | 533,769.9 |
| Depreciation, % | 4.74 | 4.59 | 4.56 | 4.71 | 4.8 | 4.68 | 4.68 | 4.68 | 4.68 | 4.68 |
| EBIT | 279,446.0 | 313,608.0 | 336,020.0 | 445,516.0 | 515,015.0 | 426,683.3 | 452,980.9 | 480,899.4 | 510,538.5 | 542,004.4 |
| EBIT, % | 4.17 | 4.24 | 4.01 | 5.24 | 6.09 | 4.75 | 4.75 | 4.75 | 4.75 | 4.75 |
| Total Cash | 1,593,224.0 | 1,205,873.0 | 819,499.0 | 1,119,625.0 | 847,561.0 | 1,312,490.4 | 1,393,382.8 | 1,479,260.7 | 1,570,431.6 | 1,667,221.5 |
| Total Cash, percent | .0 | .0 | .0 | .0 | .0 | .0 | .0 | .0 | .0 | .0 |
| Account Receivables | 1,194,391.0 | 1,324,618.0 | 1,322,593.0 | 1,361,050.0 | 1,316,172.0 | 1,492,787.3 | 1,584,791.8 | 1,682,466.8 | 1,786,161.8 | 1,896,247.8 |
| Account Receivables, % | 17.83 | 17.93 | 15.78 | 16.02 | 15.56 | 16.62 | 16.62 | 16.62 | 16.62 | 16.62 |
| Inventories | 832,569.0 | 1,132,664.0 | 1,288,751.0 | 1,208,898.0 | 1,022,225.0 | 1,247,302.9 | 1,324,177.6 | 1,405,790.3 | 1,492,432.9 | 1,584,415.6 |
| Inventories, % | 12.43 | 15.33 | 15.38 | 14.23 | 12.09 | 13.89 | 13.89 | 13.89 | 13.89 | 13.89 |
| Accounts Payable | 1,045,617.0 | 1,163,578.0 | 1,156,909.0 | 1,166,155.0 | 1,042,509.0 | 1,278,947.3 | 1,357,772.3 | 1,441,455.5 | 1,530,296.3 | 1,624,612.6 |
| Accounts Payable, % | 15.61 | 15.75 | 13.81 | 13.73 | 12.33 | 14.24 | 14.24 | 14.24 | 14.24 | 14.24 |
| Capital Expenditure | -231,118.0 | -233,967.0 | -289,353.0 | -547,470.0 | -772,332.0 | -460,552.6 | -488,937.7 | -519,072.2 | -551,064.1 | -585,027.6 |
| Capital Expenditure, % | -3.45 | -3.17 | -3.45 | -6.44 | -9.13 | -5.13 | -5.13 | -5.13 | -5.13 | -5.13 |
| Tax Rate, % | 24.69 | 24.69 | 24.69 | 24.69 | 24.69 | 24.69 | 24.69 | 24.69 | 24.69 | 24.69 |
| EBITAT | 176,865.7 | 222,186.2 | 281,957.8 | 465,165.3 | 387,837.4 | 335,677.7 | 356,366.4 | 378,330.2 | 401,647.7 | 426,402.4 |
| Depreciation | ||||||||||
| Changes in Account Receivables | ||||||||||
| Changes in Inventories | ||||||||||
| Changes in Accounts Payable | ||||||||||
| Capital Expenditure | ||||||||||
| UFCF | -718,023.3 | 15,006.2 | 214,162.8 | 368,321.3 | 129,139.4 | 130,071.0 | 223,473.5 | 237,246.7 | 251,868.9 | 267,392.2 |
| WACC, % | 6.03 | 6.11 | 6.24 | 6.41 | 6.15 | 6.19 | 6.19 | 6.19 | 6.19 | 6.19 |
| PV UFCF | ||||||||||
| SUM PV UFCF | 914,983.0 | |||||||||
| Long Term Growth Rate, % | 3.50 | |||||||||
| Free cash flow (T + 1) | 276,751 | |||||||||
| Terminal Value | 10,298,724 | |||||||||
| Present Terminal Value | 7,628,196 | |||||||||
| Enterprise Value | 8,543,179 | |||||||||
| Net Debt | 720,682 | |||||||||
| Equity Value | 7,822,497 | |||||||||
| Diluted Shares Outstanding, MM | 2,335 | |||||||||
| Equity Value Per Share | 3,349.97 |
What You Will Receive
- Authentic Panasonic Financial Data: Pre-loaded with Panasonic’s historical and projected figures for accurate analysis.
- Completely Customizable Template: Easily adjust key inputs such as revenue growth, WACC, and EBITDA percentage.
- Instant Calculations: Watch as Panasonic’s intrinsic value updates in real-time based on your modifications.
- Professional Valuation Tool: Tailored for investors, analysts, and consultants aiming for precise DCF results.
- User-Friendly Interface: Clear layout and straightforward instructions suitable for users of all experience levels.
Essential Features
- Customizable Forecast Inputs: Adjust vital parameters such as revenue growth, EBITDA %, and capital expenditures.
- Instant DCF Valuation: Quickly determines intrinsic value, NPV, and other relevant metrics.
- High-Precision Accuracy: Leverages Panasonic's actual financial data for credible valuation results.
- Simplified Scenario Analysis: Easily evaluate various assumptions and analyze their outcomes.
- Efficiency Booster: Remove the hassle of constructing intricate valuation models from the ground up.
How It Works
- 1. Access the Template: Download and open the Excel file containing Panasonic Holdings Corporation’s (6752T) preloaded data.
- 2. Modify Assumptions: Adjust essential inputs such as growth projections, WACC, and capital expenditures.
- 3. View Immediate Results: The DCF model automatically computes intrinsic value and NPV.
- 4. Explore Scenarios: Evaluate various forecasts to examine different valuation possibilities.
- 5. Present with Assurance: Share professional valuation insights to inform your decision-making process.
Why Opt for This Calculator?
- Designed for Experts: A sophisticated tool tailored for analysts, CFOs, and consultants.
- Accurate Data: Panasonic’s historical and projected financials are preloaded for precise calculations.
- Forecast Testing: Effortlessly simulate various scenarios and assumptions.
- Transparent Results: Automatically computes intrinsic value, NPV, and essential metrics.
- User-Friendly: Comprehensive step-by-step guidance helps you navigate the process.
Who Can Benefit from Panasonic Holdings Corporation (6752T)?
- Investors: Empower your investment choices with a top-tier valuation tool tailored for Panasonic Holdings Corporation (6752T).
- Financial Analysts: Streamline your analysis process using a customizable DCF model specifically designed for Panasonic Holdings Corporation (6752T).
- Consultants: Effortlessly modify the template for impactful presentations or detailed reports on Panasonic Holdings Corporation (6752T).
- Finance Enthusiasts: Enhance your grasp of valuation methods through practical examples related to Panasonic Holdings Corporation (6752T).
- Educators and Students: Utilize this resource as an effective learning aid in finance courses focusing on Panasonic Holdings Corporation (6752T).
Contents of the Template
- Preloaded Panasonic Data: Historical and projected financial data, including revenue, EBIT, and capital expenditures.
- DCF and WACC Models: Professional-grade sheets for calculating intrinsic value and Weighted Average Cost of Capital.
- Editable Inputs: Yellow-highlighted cells for adjusting revenue growth, tax rates, and discount rates.
- Financial Statements: Comprehensive annual and quarterly financials for in-depth analysis.
- Key Ratios: Profitability, leverage, and efficiency ratios to assess performance.
- Dashboard and Charts: Visual summaries of valuation results and assumptions.
Disclaimer
All information, articles, and product details provided on this website are for general informational and educational purposes only. We do not claim any ownership over, nor do we intend to infringe upon, any trademarks, copyrights, logos, brand names, or other intellectual property mentioned or depicted on this site. Such intellectual property remains the property of its respective owners, and any references here are made solely for identification or informational purposes, without implying any affiliation, endorsement, or partnership.
We make no representations or warranties, express or implied, regarding the accuracy, completeness, or suitability of any content or products presented. Nothing on this website should be construed as legal, tax, investment, financial, medical, or other professional advice. In addition, no part of this site—including articles or product references—constitutes a solicitation, recommendation, endorsement, advertisement, or offer to buy or sell any securities, franchises, or other financial instruments, particularly in jurisdictions where such activity would be unlawful.
All content is of a general nature and may not address the specific circumstances of any individual or entity. It is not a substitute for professional advice or services. Any actions you take based on the information provided here are strictly at your own risk. You accept full responsibility for any decisions or outcomes arising from your use of this website and agree to release us from any liability in connection with your use of, or reliance upon, the content or products found herein.