
|
Sharp Corporation (6753.T) Évaluation DCF |
Entièrement Modifiable: Adapté À Vos Besoins Dans Excel Ou Sheets
Conception Professionnelle: Modèles Fiables Et Conformes Aux Normes Du Secteur
Pré-Construits Pour Une Utilisation Rapide Et Efficace
Compatible MAC/PC, entièrement débloqué
Aucune Expertise N'Est Requise; Facile À Suivre
Sharp Corporation (6753.T) Bundle
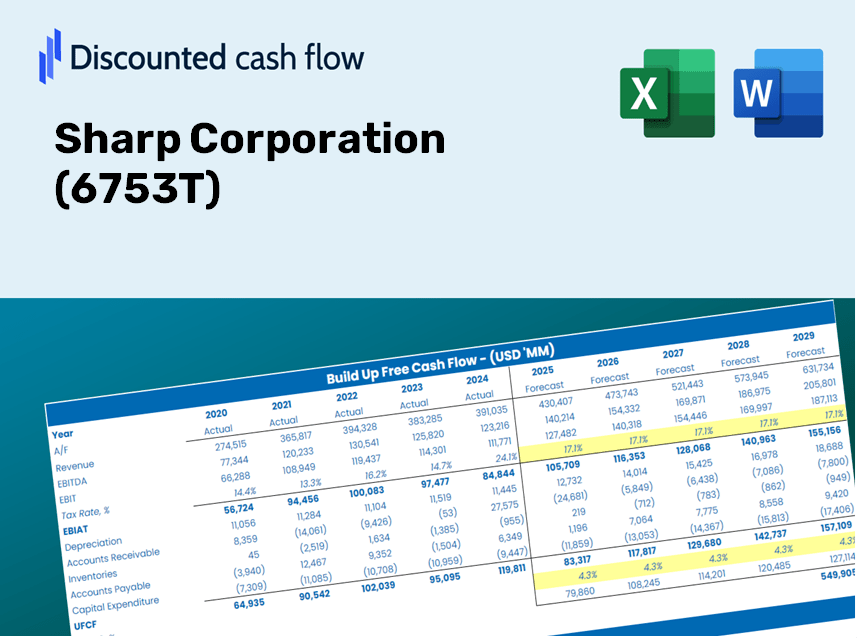
Évaluez les perspectives financières de Sharp Corporation comme un expert! Ce (6753T) Calculator DCF propose des données financières pré-remplies et une pleine flexibilité pour modifier la croissance des revenus, le WACC, les marges et d'autres hypothèses essentielles pour s'aligner sur vos projections.
Discounted Cash Flow (DCF) - (USD MM)
| Year | AY1 2021 |
AY2 2022 |
AY3 2023 |
AY4 2024 |
AY5 2025 |
FY1 2026 |
FY2 2027 |
FY3 2028 |
FY4 2029 |
FY5 2030 |
|---|---|---|---|---|---|---|---|---|---|---|
| Revenue | 2,425,910.0 | 2,495,588.0 | 2,548,117.0 | 2,321,921.0 | 2,160,146.0 | 2,101,459.4 | 2,044,367.1 | 1,988,825.9 | 1,934,793.7 | 1,882,229.4 |
| Revenue Growth, % | 0 | 2.87 | 2.1 | -8.88 | -6.97 | -2.72 | -2.72 | -2.72 | -2.72 | -2.72 |
| EBITDA | 143,895.0 | 166,647.0 | -139,948.0 | -60,547.0 | 112,392.0 | 40,820.4 | 39,711.4 | 38,632.5 | 37,583.0 | 36,561.9 |
| EBITDA, % | 5.93 | 6.68 | -5.49 | -2.61 | 5.2 | 1.94 | 1.94 | 1.94 | 1.94 | 1.94 |
| Depreciation | 71,942.0 | 72,397.0 | 89,799.0 | 66,215.0 | 48,459.0 | 60,882.4 | 59,228.4 | 57,619.3 | 56,053.9 | 54,531.0 |
| Depreciation, % | 2.97 | 2.9 | 3.52 | 2.85 | 2.24 | 2.9 | 2.9 | 2.9 | 2.9 | 2.9 |
| EBIT | 71,953.0 | 94,250.0 | -229,747.0 | -126,762.0 | 63,933.0 | -20,062.0 | -19,517.0 | -18,986.7 | -18,470.9 | -17,969.1 |
| EBIT, % | 2.97 | 3.78 | -9.02 | -5.46 | 2.96 | -0.95467 | -0.95467 | -0.95467 | -0.95467 | -0.95467 |
| Total Cash | 341,917.0 | 287,361.0 | 262,058.0 | 227,130.0 | 279,307.0 | 246,314.2 | 239,622.4 | 233,112.3 | 226,779.2 | 220,618.0 |
| Total Cash, percent | .0 | .0 | .0 | .0 | .0 | .0 | .0 | .0 | .0 | .0 |
| Account Receivables | 453,688.0 | 484,818.0 | 435,008.0 | 402,514.0 | 379,787.0 | 378,756.3 | 368,466.3 | 358,455.8 | 348,717.3 | 339,243.4 |
| Account Receivables, % | 18.7 | 19.43 | 17.07 | 17.34 | 17.58 | 18.02 | 18.02 | 18.02 | 18.02 | 18.02 |
| Inventories | 263,066.0 | 310,283.0 | 299,307.0 | 269,584.0 | 242,081.0 | 243,099.2 | 236,494.7 | 230,069.6 | 223,819.1 | 217,738.4 |
| Inventories, % | 10.84 | 12.43 | 11.75 | 11.61 | 11.21 | 11.57 | 11.57 | 11.57 | 11.57 | 11.57 |
| Accounts Payable | 396,422.0 | 422,374.0 | 371,872.0 | 355,253.0 | 278,869.0 | 319,714.7 | 311,028.7 | 302,578.7 | 294,358.3 | 286,361.2 |
| Accounts Payable, % | 16.34 | 16.92 | 14.59 | 15.3 | 12.91 | 15.21 | 15.21 | 15.21 | 15.21 | 15.21 |
| Capital Expenditure | -51,382.0 | -63,073.0 | -57,014.0 | -52,573.0 | -39,018.0 | -46,036.2 | -44,785.5 | -43,568.8 | -42,385.1 | -41,233.6 |
| Capital Expenditure, % | -2.12 | -2.53 | -2.24 | -2.26 | -1.81 | -2.19 | -2.19 | -2.19 | -2.19 | -2.19 |
| Tax Rate, % | 32.71 | 32.71 | 32.71 | 32.71 | 32.71 | 32.71 | 32.71 | 32.71 | 32.71 | 32.71 |
| EBITAT | 57,680.9 | 77,655.9 | -250,696.3 | -138,204.1 | 43,023.7 | -17,247.4 | -16,778.9 | -16,323.0 | -15,879.6 | -15,448.1 |
| Depreciation | ||||||||||
| Changes in Account Receivables | ||||||||||
| Changes in Inventories | ||||||||||
| Changes in Accounts Payable | ||||||||||
| Capital Expenditure | ||||||||||
| UFCF | -242,091.1 | 34,584.9 | -207,627.3 | -78,964.1 | 26,310.7 | 38,457.0 | 5,872.5 | 5,713.0 | 5,557.8 | 5,406.8 |
| WACC, % | 5.24 | 5.28 | 5.6 | 5.6 | 5.02 | 5.35 | 5.35 | 5.35 | 5.35 | 5.35 |
| PV UFCF | ||||||||||
| SUM PV UFCF | 55,361.9 | |||||||||
| Long Term Growth Rate, % | 2.00 | |||||||||
| Free cash flow (T + 1) | 5,515 | |||||||||
| Terminal Value | 164,741 | |||||||||
| Present Terminal Value | 126,963 | |||||||||
| Enterprise Value | 182,325 | |||||||||
| Net Debt | 242,041 | |||||||||
| Equity Value | -59,716 | |||||||||
| Diluted Shares Outstanding, MM | 649 | |||||||||
| Equity Value Per Share | -91.97 |
What You'll Receive
- Customizable Excel Template: An Excel-based DCF Calculator tailored for Sharp Corporation (6753T) with pre-filled real financial data.
- Accurate Data: Access historical financials and forward-looking projections (highlighted in the yellow cells).
- Flexible Forecasting: Adjust key assumptions such as revenue growth, EBITDA margin, and WACC.
- Real-Time Calculations: Instantly observe how your inputs affect Sharp Corporation's (6753T) valuation.
- Professional Resource: Designed for investors, CFOs, consultants, and financial analysts.
- Intuitive Interface: Organized for easy navigation and understanding, complete with step-by-step guidance.
Key Features
- Pre-Loaded Data: Sharp Corporation’s historical financial statements along with pre-filled forecasts.
- Fully Adjustable Inputs: Modify WACC, tax rates, revenue growth, and EBITDA margins as needed.
- Instant Results: Observe Sharp Corporation's intrinsic value update in real time.
- Clear Visual Outputs: Dashboard charts illustrate valuation results and key metrics effectively.
- Built for Accuracy: A professional tool tailored for analysts, investors, and finance professionals.
How It Works
- Download: Get the pre-configured Excel file featuring Sharp Corporation's (6753T) financial data.
- Customize: Tailor forecasts by adjusting factors such as revenue growth, EBITDA %, and WACC.
- Update Automatically: Watch as the intrinsic value and NPV calculations refresh in real-time.
- Test Scenarios: Develop various projections and quickly analyze different outcomes.
- Make Decisions: Leverage the valuation results to inform your investment strategy.
Why Opt for the Sharp Corporation Calculator?
- Precision: Utilizes real Sharp Corporation (6753T) financial data, ensuring reliable accuracy.
- Adaptability: Engineered for users to seamlessly adjust and experiment with inputs.
- Efficiency: Eliminate the need to create a DCF model from the ground up.
- Expert-Level: Crafted with the expertise and usability principles suited for CFOs.
- Intuitive: Simple to navigate, even for those lacking advanced financial modeling skills.
Who Should Use This Product?
- Professional Investors: Develop comprehensive and trustworthy valuation models for in-depth portfolio analysis of Sharp Corporation (6753T).
- Corporate Finance Teams: Evaluate valuation scenarios to inform and shape internal strategies for Sharp Corporation (6753T).
- Consultants and Advisors: Deliver precise valuation insights to clients considering investments in Sharp Corporation (6753T).
- Students and Educators: Utilize real-world data to enhance learning and practice in financial modeling with Sharp Corporation (6753T).
- Tech Enthusiasts: Gain insight into how technology companies like Sharp Corporation (6753T) are assessed in the market.
Contents of the Template
- Comprehensive DCF Model: Fully editable template featuring in-depth valuation calculations.
- Real-World Data: Sharp Corporation's (6753T) historical and projected financials included for analysis.
- Customizable Parameters: Easily modify WACC, growth rates, and tax assumptions to explore various scenarios.
- Financial Statements: Complete annual and quarterly breakdowns for enhanced insights.
- Key Ratios: Integrated analysis for assessing profitability, efficiency, and leverage metrics.
- Dashboard with Visual Outputs: Dynamic charts and tables providing clear, actionable results.
Disclaimer
All information, articles, and product details provided on this website are for general informational and educational purposes only. We do not claim any ownership over, nor do we intend to infringe upon, any trademarks, copyrights, logos, brand names, or other intellectual property mentioned or depicted on this site. Such intellectual property remains the property of its respective owners, and any references here are made solely for identification or informational purposes, without implying any affiliation, endorsement, or partnership.
We make no representations or warranties, express or implied, regarding the accuracy, completeness, or suitability of any content or products presented. Nothing on this website should be construed as legal, tax, investment, financial, medical, or other professional advice. In addition, no part of this site—including articles or product references—constitutes a solicitation, recommendation, endorsement, advertisement, or offer to buy or sell any securities, franchises, or other financial instruments, particularly in jurisdictions where such activity would be unlawful.
All content is of a general nature and may not address the specific circumstances of any individual or entity. It is not a substitute for professional advice or services. Any actions you take based on the information provided here are strictly at your own risk. You accept full responsibility for any decisions or outcomes arising from your use of this website and agree to release us from any liability in connection with your use of, or reliance upon, the content or products found herein.