
|
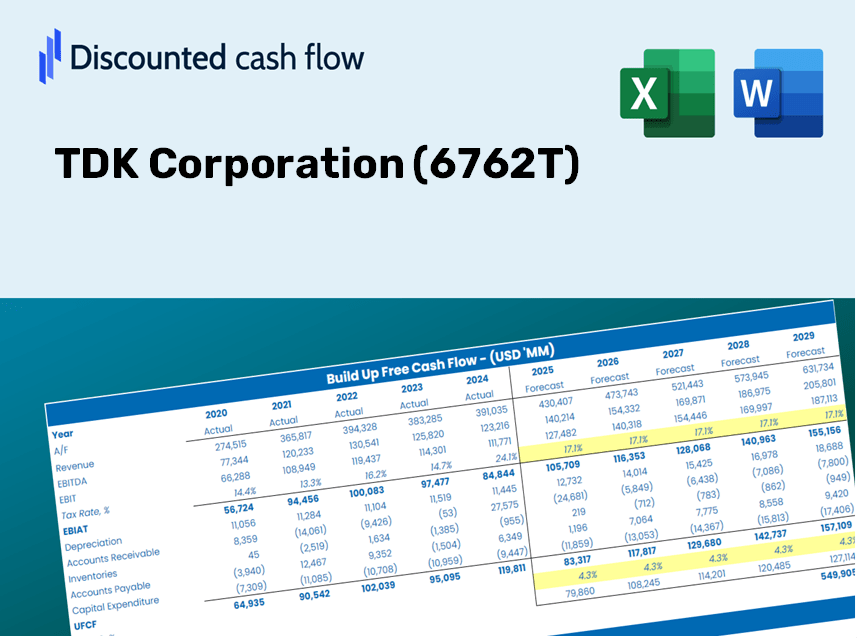
TDK Corporation (6762.T) Évaluation DCF |
Entièrement Modifiable: Adapté À Vos Besoins Dans Excel Ou Sheets
Conception Professionnelle: Modèles Fiables Et Conformes Aux Normes Du Secteur
Pré-Construits Pour Une Utilisation Rapide Et Efficace
Compatible MAC/PC, entièrement débloqué
Aucune Expertise N'Est Requise; Facile À Suivre
TDK Corporation (6762.T) Bundle
Vous cherchez à évaluer la valeur intrinsèque de TDK Corporation? Notre calculatrice DCF TDK Corporation (6762T) intègre des données réelles avec des fonctionnalités de personnalisation complètes, vous permettant d'ajuster les prévisions et d'améliorer vos stratégies d'investissement.
Discounted Cash Flow (DCF) - (USD MM)
| Year | AY1 2021 |
AY2 2022 |
AY3 2023 |
AY4 2024 |
AY5 2025 |
FY1 2026 |
FY2 2027 |
FY3 2028 |
FY4 2029 |
FY5 2030 |
|---|---|---|---|---|---|---|---|---|---|---|
| Revenue | 1,479,008.0 | 1,902,124.0 | 2,180,817.0 | 2,103,876.0 | 2,204,806.0 | 2,450,250.6 | 2,723,018.8 | 3,026,152.2 | 3,363,031.2 | 3,737,412.4 |
| Revenue Growth, % | 0 | 28.61 | 14.65 | -3.53 | 4.8 | 11.13 | 11.13 | 11.13 | 11.13 | 11.13 |
| EBITDA | 271,396.0 | 355,083.0 | 385,246.0 | 384,710.0 | 420,420.0 | 451,027.0 | 501,236.5 | 557,035.4 | 619,046.0 | 687,959.8 |
| EBITDA, % | 18.35 | 18.67 | 17.67 | 18.29 | 19.07 | 18.41 | 18.41 | 18.41 | 18.41 | 18.41 |
| Depreciation | 148,356.0 | 177,031.0 | 206,285.0 | 190,546.0 | 196,228.0 | 229,117.0 | 254,622.8 | 282,968.1 | 314,468.8 | 349,476.3 |
| Depreciation, % | 10.03 | 9.31 | 9.46 | 9.06 | 8.9 | 9.35 | 9.35 | 9.35 | 9.35 | 9.35 |
| EBIT | 123,040.0 | 178,052.0 | 178,961.0 | 194,164.0 | 224,192.0 | 221,910.0 | 246,613.6 | 274,067.3 | 304,577.2 | 338,483.5 |
| EBIT, % | 8.32 | 9.36 | 8.21 | 9.23 | 10.17 | 9.06 | 9.06 | 9.06 | 9.06 | 9.06 |
| Total Cash | 380,387.0 | 439,339.0 | 506,185.0 | 649,998.0 | 697,307.0 | 659,358.0 | 732,759.4 | 814,332.0 | 904,985.6 | 1,005,730.9 |
| Total Cash, percent | .0 | .0 | .0 | .0 | .0 | .0 | .0 | .0 | .0 | .0 |
| Account Receivables | 463,215.0 | 555,365.0 | 575,377.0 | 591,245.0 | 619,590.0 | 701,283.3 | 779,351.9 | 866,111.4 | 962,529.1 | 1,069,680.3 |
| Account Receivables, % | 31.32 | 29.2 | 26.38 | 28.1 | 28.1 | 28.62 | 28.62 | 28.62 | 28.62 | 28.62 |
| Inventories | 288,346.0 | 437,004.0 | 443,001.0 | 406,084.0 | 410,038.0 | 493,397.8 | 548,324.2 | 609,365.0 | 677,201.1 | 752,588.8 |
| Inventories, % | 19.5 | 22.97 | 20.31 | 19.3 | 18.6 | 20.14 | 20.14 | 20.14 | 20.14 | 20.14 |
| Accounts Payable | 324,373.0 | 460,132.0 | 351,439.0 | 351,940.0 | 392,502.0 | 474,209.4 | 526,999.6 | 585,666.5 | 650,864.4 | 723,320.3 |
| Accounts Payable, % | 21.93 | 24.19 | 16.12 | 16.73 | 17.8 | 19.35 | 19.35 | 19.35 | 19.35 | 19.35 |
| Capital Expenditure | -212,196.0 | -291,337.0 | -275,709.0 | -218,589.0 | -225,290.0 | -308,310.2 | -342,632.1 | -380,774.7 | -423,163.5 | -470,271.2 |
| Capital Expenditure, % | -14.35 | -15.32 | -12.64 | -10.39 | -10.22 | -12.58 | -12.58 | -12.58 | -12.58 | -12.58 |
| Tax Rate, % | 29.71 | 29.71 | 29.71 | 29.71 | 29.71 | 29.71 | 29.71 | 29.71 | 29.71 | 29.71 |
| EBITAT | 75,376.9 | 135,531.7 | 122,205.1 | 135,068.0 | 157,590.0 | 153,350.3 | 170,421.6 | 189,393.4 | 210,477.2 | 233,908.0 |
| Depreciation | ||||||||||
| Changes in Account Receivables | ||||||||||
| Changes in Inventories | ||||||||||
| Changes in Accounts Payable | ||||||||||
| Capital Expenditure | ||||||||||
| UFCF | -415,651.1 | -83,823.3 | -81,920.9 | 128,575.0 | 136,791.0 | -9,188.7 | 2,207.7 | 2,453.4 | 2,726.5 | 3,030.1 |
| WACC, % | 5.03 | 5.09 | 5.06 | 5.06 | 5.07 | 5.06 | 5.06 | 5.06 | 5.06 | 5.06 |
| PV UFCF | ||||||||||
| SUM PV UFCF | -25.4 | |||||||||
| Long Term Growth Rate, % | 3.00 | |||||||||
| Free cash flow (T + 1) | 3,121 | |||||||||
| Terminal Value | 151,347 | |||||||||
| Present Terminal Value | 118,234 | |||||||||
| Enterprise Value | 118,209 | |||||||||
| Net Debt | -88,907 | |||||||||
| Equity Value | 207,116 | |||||||||
| Diluted Shares Outstanding, MM | 1,900 | |||||||||
| Equity Value Per Share | 109.01 |
What You Will Receive
- Pre-Filled Financial Model: TDK Corporation's (6762T) actual data provides an accurate DCF valuation.
- Complete Forecast Control: Modify revenue growth, profit margins, WACC, and other essential drivers.
- Instant Calculations: Automatic updates allow you to view results in real-time as you adjust inputs.
- Investor-Ready Template: A polished Excel file crafted for high-quality valuation presentations.
- Customizable and Reusable: Designed for adaptability, enabling ongoing use for comprehensive forecasts.
Key Features
- Customizable Forecast Inputs: Adjust essential variables such as revenue growth, EBITDA %, and capital expenditures with ease.
- Instant DCF Valuation: Automatically computes intrinsic value, NPV, and additional outputs in real-time.
- High Precision Results: Leverages TDK Corporation’s (6762T) actual financial data for credible valuation assessments.
- Simplified Scenario Analysis: Experiment with various assumptions and easily analyze the resulting outcomes.
- Efficiency Booster: Remove the necessity of constructing intricate valuation models from the ground up.
How It Operates
- 1. Access the Template: Download and open the Excel file featuring TDK Corporation’s (6762T) preloaded data.
- 2. Modify Assumptions: Adjust essential inputs such as growth rates, WACC, and capital expenditures.
- 3. See Results Immediately: The DCF model automatically computes intrinsic value and NPV.
- 4. Evaluate Scenarios: Analyze various forecasts to explore different valuation possibilities.
- 5. Utilize with Assurance: Deliver expert valuation insights to enhance your decision-making process.
Why Opt for This Calculator?
- Designed for Experts: A sophisticated tool tailored for analysts, CFOs, and consultants.
- Accurate Data: TDK Corporation’s historical and projected financials are preloaded for precision.
- Scenario Analysis: Effortlessly test various forecasts and assumptions.
- Concise Results: Instantly computes intrinsic value, NPV, and essential metrics.
- User-Friendly: Step-by-step guidance to navigate the calculation process.
Who Should Use This Product?
- Investors: Assess TDK Corporation’s (6762T) valuation before making stock transactions.
- CFOs and Financial Analysts: Optimize valuation workflows and evaluate financial forecasts.
- Startup Founders: Discover how leading companies like TDK Corporation (6762T) establish their market value.
- Consultants: Create comprehensive valuation reports for your clients based on TDK Corporation (6762T).
- Students and Educators: Utilize current data to learn and teach valuation methodologies related to TDK Corporation (6762T).
Contents of the Template
- Pre-Populated Data: Features TDK Corporation’s historical financial figures and projections.
- Discounted Cash Flow Model: An editable DCF valuation model that performs automatic calculations.
- Weighted Average Cost of Capital (WACC): A dedicated worksheet for calculating WACC using customized inputs.
- Essential Financial Ratios: Evaluate TDK Corporation’s profitability, efficiency, and leverage metrics.
- Customizable Parameters: Easily modify revenue growth rates, profit margins, and tax percentages.
- Comprehensive Dashboard: Visual representations and tables that summarize key valuation outcomes.
Disclaimer
All information, articles, and product details provided on this website are for general informational and educational purposes only. We do not claim any ownership over, nor do we intend to infringe upon, any trademarks, copyrights, logos, brand names, or other intellectual property mentioned or depicted on this site. Such intellectual property remains the property of its respective owners, and any references here are made solely for identification or informational purposes, without implying any affiliation, endorsement, or partnership.
We make no representations or warranties, express or implied, regarding the accuracy, completeness, or suitability of any content or products presented. Nothing on this website should be construed as legal, tax, investment, financial, medical, or other professional advice. In addition, no part of this site—including articles or product references—constitutes a solicitation, recommendation, endorsement, advertisement, or offer to buy or sell any securities, franchises, or other financial instruments, particularly in jurisdictions where such activity would be unlawful.
All content is of a general nature and may not address the specific circumstances of any individual or entity. It is not a substitute for professional advice or services. Any actions you take based on the information provided here are strictly at your own risk. You accept full responsibility for any decisions or outcomes arising from your use of this website and agree to release us from any liability in connection with your use of, or reliance upon, the content or products found herein.