
|
Hirose Electric Co., Ltd. (6806.T) Évaluation DCF |
Entièrement Modifiable: Adapté À Vos Besoins Dans Excel Ou Sheets
Conception Professionnelle: Modèles Fiables Et Conformes Aux Normes Du Secteur
Pré-Construits Pour Une Utilisation Rapide Et Efficace
Compatible MAC/PC, entièrement débloqué
Aucune Expertise N'Est Requise; Facile À Suivre
Hirose Electric Co.,Ltd. (6806.T) Bundle
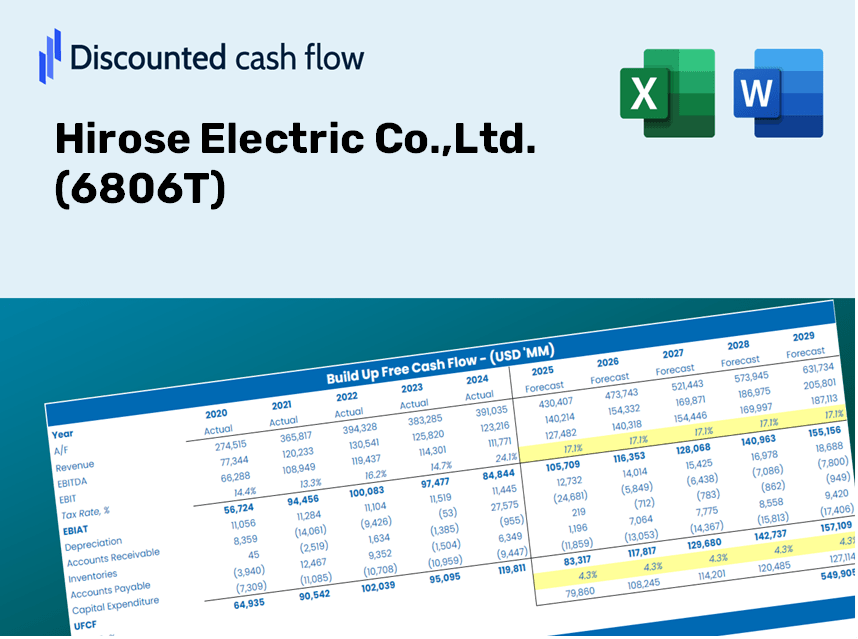
En tant qu'investisseur ou analyste, la calculatrice (6806T) DCF de Hirose Electric Co., Ltd. est votre ressource incontournable pour une évaluation précise. Avec de vraies données de Hirose Electric, vous pouvez ajuster les prévisions et observer instantanément leurs effets.
Discounted Cash Flow (DCF) - (USD MM)
| Year | AY1 2021 |
AY2 2022 |
AY3 2023 |
AY4 2024 |
AY5 2025 |
FY1 2026 |
FY2 2027 |
FY3 2028 |
FY4 2029 |
FY5 2030 |
|---|---|---|---|---|---|---|---|---|---|---|
| Revenue | 133,538.0 | 163,671.0 | 183,224.0 | 165,509.0 | 189,420.0 | 208,025.8 | 228,459.2 | 250,899.7 | 275,544.3 | 302,609.8 |
| Revenue Growth, % | 0 | 22.57 | 11.95 | -9.67 | 14.45 | 9.82 | 9.82 | 9.82 | 9.82 | 9.82 |
| EBITDA | 45,046.0 | 59,565.0 | 65,643.0 | 55,699.0 | 64,967.0 | 72,352.8 | 79,459.7 | 87,264.7 | 95,836.3 | 105,249.8 |
| EBITDA, % | 33.73 | 36.39 | 35.83 | 33.65 | 34.3 | 34.78 | 34.78 | 34.78 | 34.78 | 34.78 |
| Depreciation | 16,769.0 | 16,407.0 | 16,704.0 | 16,847.0 | 17,941.0 | 21,363.8 | 23,462.3 | 25,766.9 | 28,297.9 | 31,077.4 |
| Depreciation, % | 12.56 | 10.02 | 9.12 | 10.18 | 9.47 | 10.27 | 10.27 | 10.27 | 10.27 | 10.27 |
| EBIT | 28,277.0 | 43,158.0 | 48,939.0 | 38,852.0 | 47,026.0 | 50,989.0 | 55,997.4 | 61,497.8 | 67,538.4 | 74,172.4 |
| EBIT, % | 21.18 | 26.37 | 26.71 | 23.47 | 24.83 | 24.51 | 24.51 | 24.51 | 24.51 | 24.51 |
| Total Cash | 57,837.0 | 68,394.0 | 88,029.0 | 90,341.0 | 85,666.0 | 96,920.2 | 106,440.2 | 116,895.4 | 128,377.4 | 140,987.3 |
| Total Cash, percent | .0 | .0 | .0 | .0 | .0 | .0 | .0 | .0 | .0 | .0 |
| Account Receivables | 36,620.0 | 43,427.0 | 41,931.0 | 39,418.0 | 40,394.0 | 50,751.0 | 55,736.0 | 61,210.7 | 67,223.1 | 73,826.2 |
| Account Receivables, % | 27.42 | 26.53 | 22.89 | 23.82 | 21.33 | 24.4 | 24.4 | 24.4 | 24.4 | 24.4 |
| Inventories | 16,915.0 | 21,695.0 | 27,735.0 | 24,359.0 | 25,091.0 | 28,717.2 | 31,537.9 | 34,635.8 | 38,037.9 | 41,774.1 |
| Inventories, % | 12.67 | 13.26 | 15.14 | 14.72 | 13.25 | 13.8 | 13.8 | 13.8 | 13.8 | 13.8 |
| Accounts Payable | 19,511.0 | 23,811.0 | 20,796.0 | 11,729.0 | 12,896.0 | 22,634.8 | 24,858.1 | 27,299.8 | 29,981.3 | 32,926.2 |
| Accounts Payable, % | 14.61 | 14.55 | 11.35 | 7.09 | 6.81 | 10.88 | 10.88 | 10.88 | 10.88 | 10.88 |
| Capital Expenditure | -13,895.0 | -13,855.0 | -18,509.0 | -32,064.0 | -26,681.0 | -25,974.5 | -28,525.8 | -31,327.8 | -34,404.9 | -37,784.4 |
| Capital Expenditure, % | -10.41 | -8.47 | -10.1 | -19.37 | -14.09 | -12.49 | -12.49 | -12.49 | -12.49 | -12.49 |
| Tax Rate, % | 28.53 | 28.53 | 28.53 | 28.53 | 28.53 | 28.53 | 28.53 | 28.53 | 28.53 | 28.53 |
| EBITAT | 19,877.3 | 31,493.2 | 34,896.1 | 26,542.2 | 33,610.5 | 36,137.0 | 39,686.5 | 43,584.8 | 47,865.9 | 52,567.5 |
| Depreciation | ||||||||||
| Changes in Account Receivables | ||||||||||
| Changes in Inventories | ||||||||||
| Changes in Accounts Payable | ||||||||||
| Capital Expenditure | ||||||||||
| UFCF | -11,272.7 | 26,758.2 | 25,532.1 | 8,147.2 | 24,329.5 | 27,281.9 | 29,040.6 | 31,893.1 | 35,025.8 | 38,466.2 |
| WACC, % | 4.58 | 4.59 | 4.59 | 4.58 | 4.59 | 4.59 | 4.59 | 4.59 | 4.59 | 4.59 |
| PV UFCF | ||||||||||
| SUM PV UFCF | 140,531.0 | |||||||||
| Long Term Growth Rate, % | 2.00 | |||||||||
| Free cash flow (T + 1) | 39,236 | |||||||||
| Terminal Value | 1,517,440 | |||||||||
| Present Terminal Value | 1,212,694 | |||||||||
| Enterprise Value | 1,353,225 | |||||||||
| Net Debt | -80,465 | |||||||||
| Equity Value | 1,433,690 | |||||||||
| Diluted Shares Outstanding, MM | 34 | |||||||||
| Equity Value Per Share | 42,374.23 |
What You Will Receive
- Genuine 6806T Financial Data: Pre-loaded with Hirose Electric’s historical and forecasted data for accurate analysis.
- Completely Customizable Template: Easily adjust essential inputs such as revenue growth, WACC, and EBITDA percentage.
- Instant Calculations: Watch as Hirose Electric’s intrinsic value updates in real time based on your modifications.
- Expert Valuation Tool: Tailored for investors, analysts, and consultants looking for reliable DCF outcomes.
- Intuitive Design: Clear layout and straightforward guidance suitable for users of all experience levels.
Key Features
- Customizable Forecast Inputs: Adjust essential elements such as revenue growth, EBITDA margin, and capital expenditures.
- Instant DCF Valuation: Automatically computes intrinsic value, NPV, and other metrics in real-time.
- High-Precision Accuracy: Leverages Hirose Electric Co., Ltd.'s (6806T) actual financial data to deliver trustworthy valuation results.
- Effortless Scenario Analysis: Easily explore various assumptions and evaluate the resulting outcomes.
- Efficiency Booster: Streamline the process by avoiding the creation of intricate valuation models from ground zero.
How It Functions
- Step 1: Download the Excel file.
- Step 2: Examine Hirose Electric Co., Ltd.'s pre-filled financial data and projections.
- Step 3: Adjust essential inputs such as revenue growth, WACC, and tax rates (highlighted cells).
- Step 4: Observe the DCF model update in real-time as you modify your assumptions.
- Step 5: Evaluate the outputs and leverage the results for your investment strategies.
Why Choose This Calculator for Hirose Electric Co., Ltd. (6806T)?
- All-in-One Tool: Combines DCF, WACC, and financial ratio analyses for comprehensive evaluations.
- Flexible Inputs: Modify the yellow-highlighted cells to explore different financial scenarios.
- In-Depth Analysis: Automatically computes the intrinsic value and Net Present Value for Hirose Electric Co., Ltd.
- Preloaded Information: Access historical and projected data for reliable analysis foundations.
- High-Quality Standards: Designed for financial analysts, investors, and business advisors focused on Hirose Electric Co., Ltd. (6806T).
Who Can Benefit from Hirose Electric Co., Ltd. (6806T)?
- Investors: Make informed investment choices with a reliable valuation tool tailored for the industry.
- Financial Analysts: Streamline your workflow with a customizable DCF model specifically designed for [Symbol].
- Consultants: Effortlessly modify the template for impactful client presentations or reports focused on Hirose Electric.
- Finance Enthusiasts: Enhance your knowledge of valuation methods through practical, real-world applications related to [Symbol].
- Educators and Students: Utilize this resource as an effective tool for learning in finance courses revolving around Hirose Electric Co., Ltd.
Contents of the Template
- Historical Data: Contains Hirose Electric’s past financial performance and foundational forecasts.
- DCF and Levered DCF Models: Comprehensive templates for calculating the intrinsic value of Hirose Electric (6806T).
- WACC Sheet: Pre-configured calculations for the Weighted Average Cost of Capital.
- Editable Inputs: Customize essential parameters such as growth rates, EBITDA %, and CAPEX expectations.
- Quarterly and Annual Statements: A thorough analysis of Hirose Electric’s financial disclosures.
- Interactive Dashboard: Dynamically visualize valuation outcomes and projections.
Disclaimer
All information, articles, and product details provided on this website are for general informational and educational purposes only. We do not claim any ownership over, nor do we intend to infringe upon, any trademarks, copyrights, logos, brand names, or other intellectual property mentioned or depicted on this site. Such intellectual property remains the property of its respective owners, and any references here are made solely for identification or informational purposes, without implying any affiliation, endorsement, or partnership.
We make no representations or warranties, express or implied, regarding the accuracy, completeness, or suitability of any content or products presented. Nothing on this website should be construed as legal, tax, investment, financial, medical, or other professional advice. In addition, no part of this site—including articles or product references—constitutes a solicitation, recommendation, endorsement, advertisement, or offer to buy or sell any securities, franchises, or other financial instruments, particularly in jurisdictions where such activity would be unlawful.
All content is of a general nature and may not address the specific circumstances of any individual or entity. It is not a substitute for professional advice or services. Any actions you take based on the information provided here are strictly at your own risk. You accept full responsibility for any decisions or outcomes arising from your use of this website and agree to release us from any liability in connection with your use of, or reliance upon, the content or products found herein.