
|
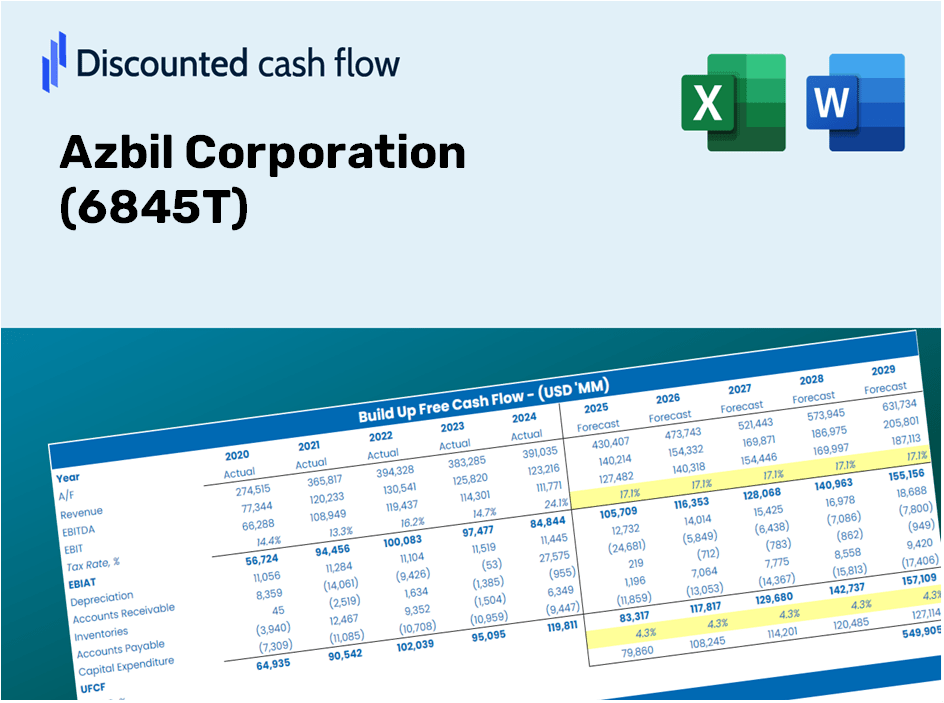
Azbil Corporation (6845.T) Évaluation DCF |
Entièrement Modifiable: Adapté À Vos Besoins Dans Excel Ou Sheets
Conception Professionnelle: Modèles Fiables Et Conformes Aux Normes Du Secteur
Pré-Construits Pour Une Utilisation Rapide Et Efficace
Compatible MAC/PC, entièrement débloqué
Aucune Expertise N'Est Requise; Facile À Suivre
Azbil Corporation (6845.T) Bundle
Que vous soyez un investisseur ou un analyste, cette (6845T) Calculator DCF est votre outil essentiel pour une évaluation précise. Avec les données réelles d'Azbil Corporation déjà chargées, vous pouvez ajuster les prévisions et observer les effets en temps réel.
Discounted Cash Flow (DCF) - (USD MM)
| Year | AY1 2021 |
AY2 2022 |
AY3 2023 |
AY4 2024 |
AY5 2025 |
FY1 2026 |
FY2 2027 |
FY3 2028 |
FY4 2029 |
FY5 2030 |
|---|---|---|---|---|---|---|---|---|---|---|
| Revenue | 246,821.0 | 256,551.0 | 278,406.0 | 290,938.0 | 300,378.0 | 315,552.3 | 331,493.1 | 348,239.3 | 365,831.4 | 384,312.2 |
| Revenue Growth, % | 0 | 3.94 | 8.52 | 4.5 | 3.24 | 5.05 | 5.05 | 5.05 | 5.05 | 5.05 |
| EBITDA | 30,206.0 | 35,014.0 | 37,219.0 | 42,931.0 | 60,024.0 | 46,697.6 | 49,056.7 | 51,534.9 | 54,138.3 | 56,873.2 |
| EBITDA, % | 12.24 | 13.65 | 13.37 | 14.76 | 19.98 | 14.8 | 14.8 | 14.8 | 14.8 | 14.8 |
| Depreciation | 4,483.0 | 4,847.0 | 4,954.0 | 6,044.0 | 6,714.0 | 6,183.3 | 6,495.7 | 6,823.8 | 7,168.5 | 7,530.7 |
| Depreciation, % | 1.82 | 1.89 | 1.78 | 2.08 | 2.24 | 1.96 | 1.96 | 1.96 | 1.96 | 1.96 |
| EBIT | 25,723.0 | 30,167.0 | 32,265.0 | 36,887.0 | 53,310.0 | 40,514.3 | 42,561.0 | 44,711.0 | 46,969.7 | 49,342.5 |
| EBIT, % | 10.42 | 11.76 | 11.59 | 12.68 | 17.75 | 12.84 | 12.84 | 12.84 | 12.84 | 12.84 |
| Total Cash | 105,011.0 | 89,754.0 | 78,706.0 | 79,979.0 | 94,895.0 | 104,058.0 | 109,314.8 | 114,837.1 | 120,638.3 | 126,732.6 |
| Total Cash, percent | .0 | .0 | .0 | .0 | .0 | .0 | .0 | .0 | .0 | .0 |
| Account Receivables | 81,773.0 | 86,135.0 | 97,098.0 | 97,757.0 | 91,744.0 | 104,589.5 | 109,873.1 | 115,423.6 | 121,254.5 | 127,380.0 |
| Account Receivables, % | 33.13 | 33.57 | 34.88 | 33.6 | 30.54 | 33.14 | 33.14 | 33.14 | 33.14 | 33.14 |
| Inventories | 24,513.0 | 28,683.0 | 37,165.0 | 43,777.0 | 37,625.0 | 39,149.7 | 41,127.5 | 43,205.1 | 45,387.7 | 47,680.6 |
| Inventories, % | 9.93 | 11.18 | 13.35 | 15.05 | 12.53 | 12.41 | 12.41 | 12.41 | 12.41 | 12.41 |
| Accounts Payable | 31,951.0 | 22,990.0 | 24,705.0 | 20,472.0 | 16,089.0 | 27,246.5 | 28,622.9 | 30,068.9 | 31,587.9 | 33,183.6 |
| Accounts Payable, % | 12.95 | 8.96 | 8.87 | 7.04 | 5.36 | 8.63 | 8.63 | 8.63 | 8.63 | 8.63 |
| Capital Expenditure | -12,622.0 | -15,322.0 | -10,216.0 | -7,688.0 | -10,217.0 | -13,126.6 | -13,789.8 | -14,486.4 | -15,218.2 | -15,987.0 |
| Capital Expenditure, % | -5.11 | -5.97 | -3.67 | -2.64 | -3.4 | -4.16 | -4.16 | -4.16 | -4.16 | -4.16 |
| Tax Rate, % | 22.92 | 22.92 | 22.92 | 22.92 | 22.92 | 22.92 | 22.92 | 22.92 | 22.92 | 22.92 |
| EBITAT | 18,292.4 | 20,869.1 | 22,705.4 | 26,603.1 | 41,092.2 | 29,159.4 | 30,632.4 | 32,179.9 | 33,805.6 | 35,513.3 |
| Depreciation | ||||||||||
| Changes in Account Receivables | ||||||||||
| Changes in Inventories | ||||||||||
| Changes in Accounts Payable | ||||||||||
| Capital Expenditure | ||||||||||
| UFCF | -64,181.6 | -7,098.9 | -286.6 | 13,455.1 | 45,371.2 | 19,003.3 | 17,453.5 | 18,335.2 | 19,261.4 | 20,234.5 |
| WACC, % | 5.7 | 5.7 | 5.7 | 5.7 | 5.71 | 5.7 | 5.7 | 5.7 | 5.7 | 5.7 |
| PV UFCF | ||||||||||
| SUM PV UFCF | 79,883.6 | |||||||||
| Long Term Growth Rate, % | 2.00 | |||||||||
| Free cash flow (T + 1) | 20,639 | |||||||||
| Terminal Value | 557,151 | |||||||||
| Present Terminal Value | 422,189 | |||||||||
| Enterprise Value | 502,073 | |||||||||
| Net Debt | -83,013 | |||||||||
| Equity Value | 585,086 | |||||||||
| Diluted Shares Outstanding, MM | 525 | |||||||||
| Equity Value Per Share | 1,113.74 |
Benefits You Will Receive
- Flexible Forecast Inputs: Effortlessly adjust key assumptions (growth %, margins, WACC) to explore various scenarios.
- Comprehensive Data: Azbil Corporation’s financial information pre-loaded to kickstart your analysis.
- Instant DCF Outputs: The template automatically computes Net Present Value (NPV) and intrinsic value for your convenience.
- Tailored and Professional: A sleek Excel model designed to meet your valuation requirements.
- Designed for Analysts and Investors: Perfect for evaluating projections, validating strategies, and maximizing efficiency.
Key Features
- Pre-Loaded Data: Azbil Corporation's historical financial statements and pre-filled forecasts.
- Fully Adjustable Inputs: Modify WACC, tax rates, revenue growth, and EBITDA margins as needed.
- Instant Results: View Azbil Corporation's intrinsic value recalculated in real time.
- Clear Visual Outputs: Dashboard charts present valuation results and essential metrics.
- Built for Accuracy: A professional tool designed for analysts, investors, and finance experts.
How It Works
- Step 1: Download the Excel file for Azbil Corporation (6845T).
- Step 2: Examine the pre-filled financial data and projections for Azbil Corporation (6845T).
- Step 3: Adjust key inputs such as revenue growth, WACC, and tax rates (highlighted cells).
- Step 4: Observe the DCF model updating in real-time as you modify your assumptions.
- Step 5: Review the outputs and utilize the results to inform your investment choices for Azbil Corporation (6845T).
Why Opt for This Calculator?
- Precision: Accurate financial data from Azbil Corporation guarantees reliability.
- Versatility: Crafted for users to easily modify inputs and experiment.
- Efficiency: Avoid the complexity of building a DCF model from the ground up.
- Expert Quality: Designed with the expertise and usability suitable for CFOs.
- Intuitive Design: Simple to navigate, even for those without extensive financial modeling skills.
Who Can Benefit from This Product?
- Finance Students: Master valuation techniques and apply them to real-world data.
- Researchers: Integrate industry-standard models into your academic work or studies.
- Investors: Validate your hypotheses and evaluate valuation trends for Azbil Corporation (6845T).
- Financial Analysts: Enhance your efficiency with a ready-to-use, customizable DCF model.
- Small Business Entrepreneurs: Understand the analysis methods used for major public companies like Azbil Corporation (6845T).
Contents of the Template
- Pre-Filled DCF Model: Azbil Corporation’s financial data preloaded for immediate application.
- WACC Calculator: Comprehensive calculations for the Weighted Average Cost of Capital.
- Financial Ratios: Assess Azbil Corporation’s profitability, leverage, and efficiency.
- Editable Inputs: Modify assumptions such as growth, margins, and CAPEX to customize your scenarios.
- Financial Statements: Annual and quarterly reports to facilitate in-depth analysis.
- Interactive Dashboard: Visually engage with key valuation metrics and outcomes.
Disclaimer
All information, articles, and product details provided on this website are for general informational and educational purposes only. We do not claim any ownership over, nor do we intend to infringe upon, any trademarks, copyrights, logos, brand names, or other intellectual property mentioned or depicted on this site. Such intellectual property remains the property of its respective owners, and any references here are made solely for identification or informational purposes, without implying any affiliation, endorsement, or partnership.
We make no representations or warranties, express or implied, regarding the accuracy, completeness, or suitability of any content or products presented. Nothing on this website should be construed as legal, tax, investment, financial, medical, or other professional advice. In addition, no part of this site—including articles or product references—constitutes a solicitation, recommendation, endorsement, advertisement, or offer to buy or sell any securities, franchises, or other financial instruments, particularly in jurisdictions where such activity would be unlawful.
All content is of a general nature and may not address the specific circumstances of any individual or entity. It is not a substitute for professional advice or services. Any actions you take based on the information provided here are strictly at your own risk. You accept full responsibility for any decisions or outcomes arising from your use of this website and agree to release us from any liability in connection with your use of, or reliance upon, the content or products found herein.