
|
Horiba, Ltd. (6856.T) Évaluation DCF |
Entièrement Modifiable: Adapté À Vos Besoins Dans Excel Ou Sheets
Conception Professionnelle: Modèles Fiables Et Conformes Aux Normes Du Secteur
Pré-Construits Pour Une Utilisation Rapide Et Efficace
Compatible MAC/PC, entièrement débloqué
Aucune Expertise N'Est Requise; Facile À Suivre
HORIBA, Ltd. (6856.T) Bundle
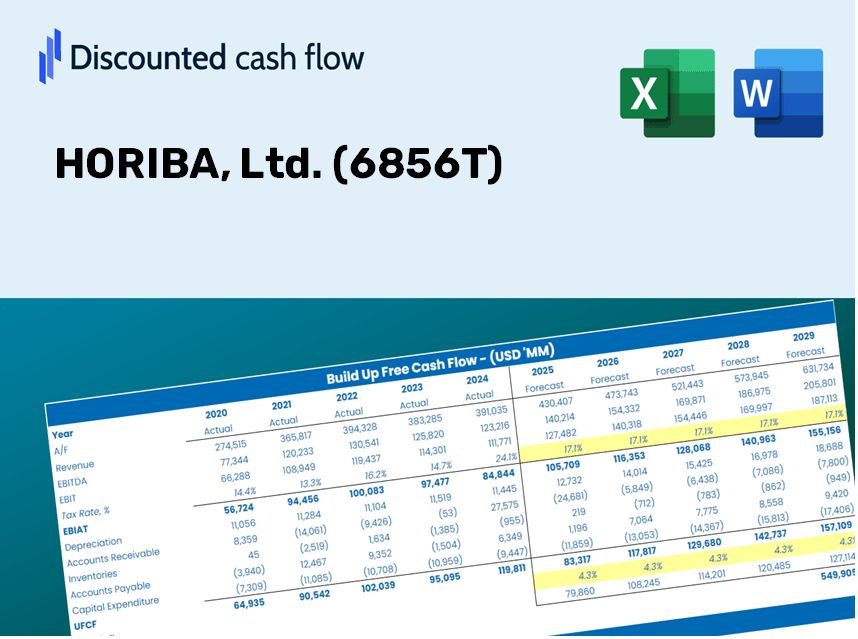
Que vous soyez un investisseur ou un analyste, ce (6856T) Calculator DCF est votre ressource incontournable pour une évaluation précise. Préchargé avec des données réelles de Horiba, Ltd., vous pouvez ajuster les prévisions et observer immédiatement les effets.
Discounted Cash Flow (DCF) - (USD MM)
| Year | AY1 2020 |
AY2 2021 |
AY3 2022 |
AY4 2023 |
AY5 2024 |
FY1 2025 |
FY2 2026 |
FY3 2027 |
FY4 2028 |
FY5 2029 |
|---|---|---|---|---|---|---|---|---|---|---|
| Revenue | 187,080.0 | 224,314.0 | 270,133.0 | 290,558.0 | 317,369.0 | 362,687.3 | 414,476.8 | 473,661.5 | 541,297.4 | 618,591.3 |
| Revenue Growth, % | 0 | 19.9 | 20.43 | 7.56 | 9.23 | 14.28 | 14.28 | 14.28 | 14.28 | 14.28 |
| EBITDA | 29,037.0 | 41,160.0 | 57,192.0 | 67,027.0 | 61,400.0 | 70,693.0 | 80,787.5 | 92,323.4 | 105,506.6 | 120,572.3 |
| EBITDA, % | 15.52 | 18.35 | 21.17 | 23.07 | 19.35 | 19.49 | 19.49 | 19.49 | 19.49 | 19.49 |
| Depreciation | 9,618.0 | 10,440.0 | 11,348.0 | 12,602.0 | 13,059.0 | 16,283.3 | 18,608.5 | 21,265.6 | 24,302.2 | 27,772.4 |
| Depreciation, % | 5.14 | 4.65 | 4.2 | 4.34 | 4.11 | 4.49 | 4.49 | 4.49 | 4.49 | 4.49 |
| EBIT | 19,419.0 | 30,720.0 | 45,844.0 | 54,425.0 | 48,341.0 | 54,409.7 | 62,179.0 | 71,057.8 | 81,204.4 | 92,799.9 |
| EBIT, % | 10.38 | 13.7 | 16.97 | 18.73 | 15.23 | 15 | 15 | 15 | 15 | 15 |
| Total Cash | 116,502.0 | 137,035.0 | 141,354.0 | 134,775.0 | 146,334.0 | 194,535.0 | 222,313.3 | 254,058.3 | 290,336.2 | 331,794.4 |
| Total Cash, percent | .0 | .0 | .0 | .0 | .0 | .0 | .0 | .0 | .0 | .0 |
| Account Receivables | 49,841.0 | 58,645.0 | 68,498.0 | 70,224.0 | 79,774.0 | 92,447.2 | 105,648.1 | 120,734.0 | 137,974.0 | 157,675.9 |
| Account Receivables, % | 26.64 | 26.14 | 25.36 | 24.17 | 25.14 | 25.49 | 25.49 | 25.49 | 25.49 | 25.49 |
| Inventories | 49,250.0 | 53,113.0 | 75,271.0 | 99,473.0 | 97,677.0 | 103,641.7 | 118,441.1 | 135,353.8 | 154,681.5 | 176,769.0 |
| Inventories, % | 26.33 | 23.68 | 27.86 | 34.24 | 30.78 | 28.58 | 28.58 | 28.58 | 28.58 | 28.58 |
| Accounts Payable | 20,264.0 | 29,546.0 | 36,945.0 | 30,518.0 | 20,321.0 | 39,595.5 | 45,249.5 | 51,710.8 | 59,094.8 | 67,533.1 |
| Accounts Payable, % | 10.83 | 13.17 | 13.68 | 10.5 | 6.4 | 10.92 | 10.92 | 10.92 | 10.92 | 10.92 |
| Capital Expenditure | -15,045.0 | -12,572.0 | -12,083.0 | -9,171.0 | -18,152.0 | -19,581.9 | -22,378.0 | -25,573.5 | -29,225.2 | -33,398.4 |
| Capital Expenditure, % | -8.04 | -5.6 | -4.47 | -3.16 | -5.72 | -5.4 | -5.4 | -5.4 | -5.4 | -5.4 |
| Tax Rate, % | 31.21 | 31.21 | 31.21 | 31.21 | 31.21 | 31.21 | 31.21 | 31.21 | 31.21 | 31.21 |
| EBITAT | 13,607.0 | 21,675.1 | 33,042.7 | 40,843.8 | 33,253.2 | 38,798.3 | 44,338.5 | 50,669.7 | 57,905.1 | 66,173.6 |
| Depreciation | ||||||||||
| Changes in Account Receivables | ||||||||||
| Changes in Inventories | ||||||||||
| Changes in Accounts Payable | ||||||||||
| Capital Expenditure | ||||||||||
| UFCF | -70,647.0 | 16,158.1 | 7,695.7 | 11,919.8 | 10,209.2 | 36,136.3 | 18,222.6 | 20,824.7 | 23,798.4 | 27,196.6 |
| WACC, % | 6.98 | 6.99 | 6.99 | 7 | 6.98 | 6.99 | 6.99 | 6.99 | 6.99 | 6.99 |
| PV UFCF | ||||||||||
| SUM PV UFCF | 104,265.9 | |||||||||
| Long Term Growth Rate, % | 0.50 | |||||||||
| Free cash flow (T + 1) | 27,333 | |||||||||
| Terminal Value | 421,269 | |||||||||
| Present Terminal Value | 300,525 | |||||||||
| Enterprise Value | 404,791 | |||||||||
| Net Debt | -79,868 | |||||||||
| Equity Value | 484,659 | |||||||||
| Diluted Shares Outstanding, MM | 42 | |||||||||
| Equity Value Per Share | 11,475.29 |
What You'll Receive
- Customizable Excel Template: A fully adjustable Excel-based DCF Calculator featuring pre-filled actual financial data for HORIBA, Ltd. (6856T).
- Authentic Data: Access to historical performance metrics and future projections (highlighted in the yellow cells).
- Flexible Forecasting: Modify key assumptions such as revenue growth, EBITDA margin, and WACC.
- Instant Calculations: Quickly observe how your inputs influence the valuation of HORIBA, Ltd. (6856T).
- Professional Resource: Designed specifically for investors, CFOs, consultants, and financial analysts.
- User-Centric Design: Organized for easy navigation and understanding, complete with step-by-step guidelines.
Key Features
- Comprehensive DCF Calculator: Features detailed unlevered and levered DCF valuation models tailored for HORIBA, Ltd. (6856T).
- WACC Calculator: Comes with a pre-formulated Weighted Average Cost of Capital sheet, allowing for customizable inputs specific to HORIBA, Ltd. (6856T).
- Customizable Forecast Assumptions: Adjust growth rates, capital expenditures, and discount rates to reflect the financial outlook of HORIBA, Ltd. (6856T).
- Integrated Financial Ratios: Evaluate profitability, leverage, and efficiency ratios specifically for HORIBA, Ltd. (6856T).
- Interactive Dashboard and Charts: Visual representations provide a concise summary of key valuation metrics for straightforward analysis of HORIBA, Ltd. (6856T).
How It Works
- Step 1: Download the Excel template for HORIBA, Ltd. (6856T).
- Step 2: Examine the pre-filled financial data and forecasts specific to HORIBA.
- Step 3: Adjust key parameters such as revenue growth, WACC, and tax rates (marked cells).
- Step 4: Observe the DCF model refresh in real time as you modify your assumptions.
- Step 5: Evaluate the results and leverage the findings for your investment strategies.
Why Opt for HORIBA's Calculator?
- Time-Saving: There's no need to build a DCF model from the ground up – it's immediately available for use.
- Enhanced Accuracy: Dependable financial data and formulas minimize valuation errors.
- Completely Customizable: Adjust the model to align with your specific assumptions and forecasts.
- Simple to Understand: Intuitive charts and outputs facilitate easy analysis of the results.
- Endorsed by Professionals: Crafted for users who prioritize precision and user-friendliness.
Who Can Benefit from This Product?
- Individual Investors: Make educated choices regarding the purchase or sale of HORIBA, Ltd. (6856T) shares.
- Financial Analysts: Enhance valuation accuracy with easily accessible financial models tailored for HORIBA, Ltd. (6856T).
- Consultants: Provide clients with swift and precise valuation insights relating to HORIBA, Ltd. (6856T).
- Business Owners: Gain insights into the valuation methods of major companies like HORIBA, Ltd. (6856T) to refine your strategic approach.
- Finance Students: Grasp valuation methodologies through practical applications using data from HORIBA, Ltd. (6856T).
Contents of the Template
- Pre-Filled DCF Model: HORIBA's financial data preloaded for immediate use.
- WACC Calculator: Comprehensive computations for Weighted Average Cost of Capital.
- Financial Ratios: Assess HORIBA's profitability, leverage, and operational efficiency.
- Editable Inputs: Modify assumptions such as growth rates, profit margins, and CAPEX to suit your scenarios.
- Financial Statements: Annual and quarterly reports for thorough analysis.
- Interactive Dashboard: Effortlessly visualize key valuation metrics and outcomes.
Disclaimer
All information, articles, and product details provided on this website are for general informational and educational purposes only. We do not claim any ownership over, nor do we intend to infringe upon, any trademarks, copyrights, logos, brand names, or other intellectual property mentioned or depicted on this site. Such intellectual property remains the property of its respective owners, and any references here are made solely for identification or informational purposes, without implying any affiliation, endorsement, or partnership.
We make no representations or warranties, express or implied, regarding the accuracy, completeness, or suitability of any content or products presented. Nothing on this website should be construed as legal, tax, investment, financial, medical, or other professional advice. In addition, no part of this site—including articles or product references—constitutes a solicitation, recommendation, endorsement, advertisement, or offer to buy or sell any securities, franchises, or other financial instruments, particularly in jurisdictions where such activity would be unlawful.
All content is of a general nature and may not address the specific circumstances of any individual or entity. It is not a substitute for professional advice or services. Any actions you take based on the information provided here are strictly at your own risk. You accept full responsibility for any decisions or outcomes arising from your use of this website and agree to release us from any liability in connection with your use of, or reliance upon, the content or products found herein.