
|
Ningbo Ronbay New Energy Technology Co., Ltd. (688005.SS) Évaluation DCF |
Entièrement Modifiable: Adapté À Vos Besoins Dans Excel Ou Sheets
Conception Professionnelle: Modèles Fiables Et Conformes Aux Normes Du Secteur
Pré-Construits Pour Une Utilisation Rapide Et Efficace
Compatible MAC/PC, entièrement débloqué
Aucune Expertise N'Est Requise; Facile À Suivre
Ningbo Ronbay New Energy Technology Co., Ltd. (688005.SS) Bundle
Gardez un aperçu de votre analyse d'évaluation de votre Ningbo Ronbay New Energy Technology Co., Ltd. (688005SS) avec notre calculatrice DCF de pointe! Préchargé avec des données précises (688005SS), ce modèle Excel vous permet d'ajuster les prévisions et les hypothèses pour déterminer la valeur intrinsèque de Ningbo Ronbay avec précision.
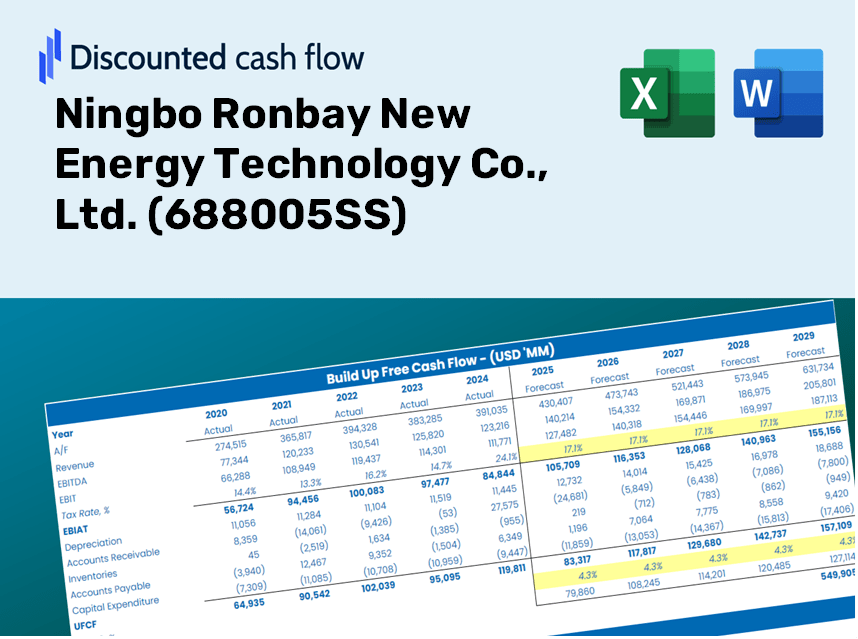
Discounted Cash Flow (DCF) - (USD MM)
| Year | AY1 2020 |
AY2 2021 |
AY3 2022 |
AY4 2023 |
AY5 2024 |
FY1 2025 |
FY2 2026 |
FY3 2027 |
FY4 2028 |
FY5 2029 |
|---|---|---|---|---|---|---|---|---|---|---|
| Revenue | 3,794.6 | 10,259.0 | 30,123.0 | 22,657.3 | 15,087.6 | 20,436.3 | 27,681.3 | 37,494.8 | 50,787.3 | 68,792.1 |
| Revenue Growth, % | 0 | 170.36 | 193.62 | -24.78 | -33.41 | 35.45 | 35.45 | 35.45 | 35.45 | 35.45 |
| EBITDA | 346.2 | 1,133.2 | 2,023.1 | 1,335.1 | 1,144.7 | 1,649.9 | 2,234.8 | 3,027.0 | 4,100.2 | 5,553.8 |
| EBITDA, % | 9.12 | 11.05 | 6.72 | 5.89 | 7.59 | 8.07 | 8.07 | 8.07 | 8.07 | 8.07 |
| Depreciation | 138.1 | 177.9 | 313.8 | 433.6 | 606.3 | 504.7 | 683.6 | 925.9 | 1,254.2 | 1,698.8 |
| Depreciation, % | 3.64 | 1.73 | 1.04 | 1.91 | 4.02 | 2.47 | 2.47 | 2.47 | 2.47 | 2.47 |
| EBIT | 208.1 | 955.3 | 1,709.3 | 901.5 | 538.4 | 1,145.2 | 1,551.2 | 2,101.1 | 2,846.0 | 3,854.9 |
| EBIT, % | 5.48 | 9.31 | 5.67 | 3.98 | 3.57 | 5.6 | 5.6 | 5.6 | 5.6 | 5.6 |
| Total Cash | 1,614.4 | 2,828.1 | 5,071.5 | 5,797.3 | 3,630.7 | 5,583.2 | 7,562.5 | 10,243.5 | 13,875.0 | 18,794.0 |
| Total Cash, percent | .0 | .0 | .0 | .0 | .0 | .0 | .0 | .0 | .0 | .0 |
| Account Receivables | 1,580.7 | 4,474.7 | 7,699.6 | 7,367.3 | 7,890.0 | 7,996.5 | 10,831.4 | 14,671.3 | 19,872.5 | 26,917.6 |
| Account Receivables, % | 41.66 | 43.62 | 25.56 | 32.52 | 52.29 | 39.13 | 39.13 | 39.13 | 39.13 | 39.13 |
| Inventories | 584.0 | 1,667.8 | 3,296.9 | 1,532.7 | 2,222.1 | 2,619.3 | 3,547.9 | 4,805.6 | 6,509.3 | 8,816.9 |
| Inventories, % | 15.39 | 16.26 | 10.94 | 6.76 | 14.73 | 12.82 | 12.82 | 12.82 | 12.82 | 12.82 |
| Accounts Payable | 1,168.8 | 5,124.4 | 10,005.9 | 7,233.2 | 8,572.6 | 8,285.4 | 11,222.7 | 15,201.4 | 20,590.5 | 27,890.2 |
| Accounts Payable, % | 30.8 | 49.95 | 33.22 | 31.92 | 56.82 | 40.54 | 40.54 | 40.54 | 40.54 | 40.54 |
| Capital Expenditure | -314.5 | -1,904.0 | -3,090.6 | -1,636.9 | -1,775.7 | -2,293.0 | -3,105.9 | -4,207.0 | -5,698.4 | -7,718.6 |
| Capital Expenditure, % | -8.29 | -18.56 | -10.26 | -7.22 | -11.77 | -11.22 | -11.22 | -11.22 | -11.22 | -11.22 |
| Tax Rate, % | 31.15 | 31.15 | 31.15 | 31.15 | 31.15 | 31.15 | 31.15 | 31.15 | 31.15 | 31.15 |
| EBITAT | 190.0 | 859.4 | 1,461.6 | 677.2 | 370.7 | 940.8 | 1,274.3 | 1,726.1 | 2,338.0 | 3,166.9 |
| Depreciation | ||||||||||
| Changes in Account Receivables | ||||||||||
| Changes in Inventories | ||||||||||
| Changes in Accounts Payable | ||||||||||
| Capital Expenditure | ||||||||||
| UFCF | -982.2 | -888.9 | -1,287.7 | -1,202.2 | -671.4 | -1,638.4 | -1,974.1 | -2,674.0 | -3,622.0 | -4,906.0 |
| WACC, % | 7.32 | 7.31 | 7.27 | 7.18 | 7.12 | 7.24 | 7.24 | 7.24 | 7.24 | 7.24 |
| PV UFCF | ||||||||||
| SUM PV UFCF | -11,610.2 | |||||||||
| Long Term Growth Rate, % | 3.50 | |||||||||
| Free cash flow (T + 1) | -5,078 | |||||||||
| Terminal Value | -135,786 | |||||||||
| Present Terminal Value | -95,738 | |||||||||
| Enterprise Value | -107,348 | |||||||||
| Net Debt | 1,375 | |||||||||
| Equity Value | -108,723 | |||||||||
| Diluted Shares Outstanding, MM | 705 | |||||||||
| Equity Value Per Share | -154.30 |
Your Benefits
- Adjustable Forecast Parameters: Effortlessly modify key inputs (growth %, margins, WACC) to explore various scenarios.
- Industry Data at Your Fingertips: Pre-filled financial data for Ningbo Ronbay New Energy Technology Co., Ltd. (688005SS) to accelerate your analysis.
- Instant DCF Calculations: The model computes Net Present Value (NPV) and intrinsic value automatically.
- Professional and Customizable Design: A refined Excel template that can be tailored to fit your valuation requirements.
- Designed for Analysts and Investors: Perfect for evaluating projections, confirming strategies, and enhancing efficiency.
Key Features
- Advanced DCF Calculator: Features comprehensive unlevered and levered DCF valuation models tailored for Ningbo Ronbay New Energy Technology Co., Ltd. (688005SS).
- WACC Calculator: Comes with a ready-to-use Weighted Average Cost of Capital sheet that allows for customizable inputs.
- Editable Forecast Assumptions: Adjust growth rates, capital expenditures, and discount rates as needed.
- Built-In Financial Ratios: Evaluate profitability, leverage, and efficiency ratios specifically for Ningbo Ronbay New Energy Technology Co., Ltd. (688005SS).
- Dashboard and Charts: Visual representations provide a clear summary of key valuation metrics for straightforward analysis.
How It Functions
- Download: Obtain the pre-prepared Excel file containing Ningbo Ronbay New Energy Technology Co., Ltd.’s (688005SS) financial data.
- Customize: Tailor your forecasts, including revenue growth, EBITDA %, and WACC as needed.
- Update Automatically: The calculations for intrinsic value and NPV refresh in real-time.
- Test Scenarios: Generate various projections and swiftly compare the results.
- Make Decisions: Utilize the valuation outcomes to inform your investment strategy.
Why Opt for This Calculator for Ningbo Ronbay New Energy Technology Co., Ltd. (688005SS)?
- Precise Financial Data: Utilize authentic financials from Ningbo Ronbay for trustworthy valuation outcomes.
- Flexible Adjustments: Modify essential parameters like growth rates, WACC, and tax rates to align with your forecasts.
- Efficiency Boost: Pre-configured calculations save you from starting from square one.
- Professional Quality: Tailored for investors, analysts, and consultants in the energy sector.
- User-Friendly Interface: An intuitive design and clear step-by-step guidance make it accessible for everyone.
Who Can Benefit from Ningbo Ronbay New Energy Technology Co., Ltd. (688005SS)?
- Investors: Make informed decisions with a robust valuation tool tailored for your needs.
- Financial Analysts: Streamline your workflow with an easily customizable DCF model at your fingertips.
- Consultants: Efficiently modify the template for impactful presentations or client reports.
- Finance Enthusiasts: Enhance your knowledge of valuation practices through practical, real-world examples.
- Educators and Students: Utilize this tool as a valuable resource in finance-related academic programs.
Overview of the Template's Features
- Pre-Filled DCF Model: Ningbo Ronbay New Energy Technology Co., Ltd.'s financial data preloaded for immediate analysis.
- WACC Calculator: Comprehensive calculations for Weighted Average Cost of Capital.
- Financial Ratios: Assess Ningbo Ronbay's profitability, leverage, and operational efficiency.
- Editable Inputs: Adjust parameters like growth rates, profit margins, and CAPEX to align with your projections.
- Financial Statements: Access annual and quarterly reports for thorough evaluation.
- Interactive Dashboard: Effortlessly visualize essential valuation metrics and outcomes.
Disclaimer
All information, articles, and product details provided on this website are for general informational and educational purposes only. We do not claim any ownership over, nor do we intend to infringe upon, any trademarks, copyrights, logos, brand names, or other intellectual property mentioned or depicted on this site. Such intellectual property remains the property of its respective owners, and any references here are made solely for identification or informational purposes, without implying any affiliation, endorsement, or partnership.
We make no representations or warranties, express or implied, regarding the accuracy, completeness, or suitability of any content or products presented. Nothing on this website should be construed as legal, tax, investment, financial, medical, or other professional advice. In addition, no part of this site—including articles or product references—constitutes a solicitation, recommendation, endorsement, advertisement, or offer to buy or sell any securities, franchises, or other financial instruments, particularly in jurisdictions where such activity would be unlawful.
All content is of a general nature and may not address the specific circumstances of any individual or entity. It is not a substitute for professional advice or services. Any actions you take based on the information provided here are strictly at your own risk. You accept full responsibility for any decisions or outcomes arising from your use of this website and agree to release us from any liability in connection with your use of, or reliance upon, the content or products found herein.