
|
Mabwell Bioscience Co., Ltd. (688062.SS) Évaluation DCF |
Entièrement Modifiable: Adapté À Vos Besoins Dans Excel Ou Sheets
Conception Professionnelle: Modèles Fiables Et Conformes Aux Normes Du Secteur
Pré-Construits Pour Une Utilisation Rapide Et Efficace
Compatible MAC/PC, entièrement débloqué
Aucune Expertise N'Est Requise; Facile À Suivre
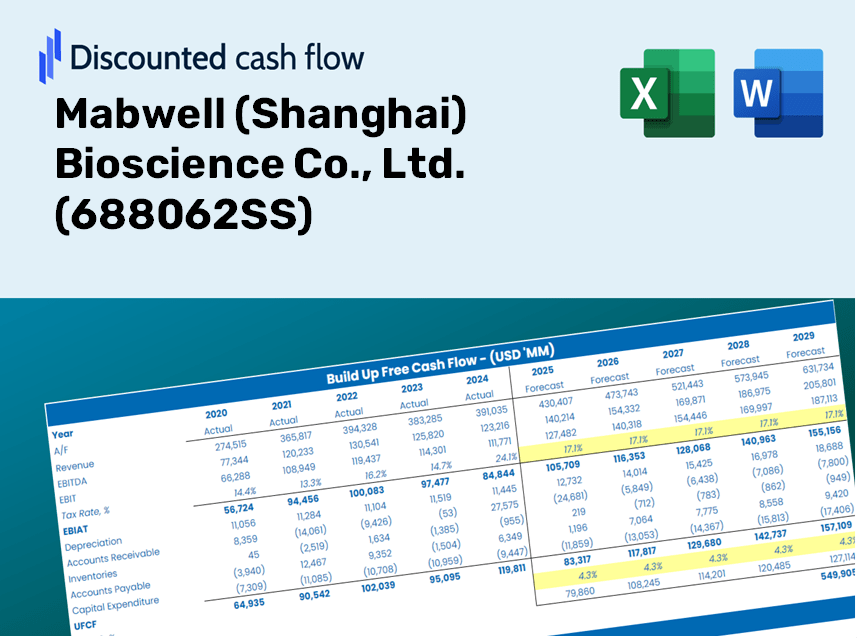
Mabwell (Shanghai) Bioscience Co., Ltd. (688062.SS) Bundle
Gagnez du temps et améliorez la précision avec notre calculatrice DCF [688062SS]! Équipé de données de Mabwell réelles et d'hypothèses personnalisables, cet outil vous permet de prévoir, analyser et valoriser Mabwell (Shanghai) Bioscience Co., Ltd. comme un investisseur chevronné.
Discounted Cash Flow (DCF) - (USD MM)
| Year | AY1 2020 |
AY2 2021 |
AY3 2022 |
AY4 2023 |
AY5 2024 |
FY1 2025 |
FY2 2026 |
FY3 2027 |
FY4 2028 |
FY5 2029 |
|---|---|---|---|---|---|---|---|---|---|---|
| Revenue | 5.3 | 16.2 | 27.7 | 127.8 | 199.8 | 363.2 | 660.2 | 1,200.3 | 2,182.0 | 3,966.6 |
| Revenue Growth, % | 0 | 206.03 | 70.88 | 361.03 | 56.28 | 81.79 | 81.79 | 81.79 | 81.79 | 81.79 |
| EBITDA | -611.8 | -739.4 | -938.0 | -1,013.0 | -930.4 | -363.2 | -660.2 | -1,200.3 | -2,182.0 | -3,966.6 |
| EBITDA, % | -11538.08 | -4556.84 | -3382.71 | -792.43 | -465.69 | -100 | -100 | -100 | -100 | -100 |
| Depreciation | 56.4 | 62.0 | 64.4 | 74.4 | 96.9 | 295.4 | 537.0 | 976.3 | 1,774.8 | 3,226.5 |
| Depreciation, % | 1063.58 | 382.33 | 232.35 | 58.22 | 48.48 | 81.34 | 81.34 | 81.34 | 81.34 | 81.34 |
| EBIT | -668.2 | -801.4 | -1,002.4 | -1,087.4 | -1,027.2 | -363.2 | -660.2 | -1,200.3 | -2,182.0 | -3,966.6 |
| EBIT, % | -12601.66 | -4939.16 | -3615.06 | -850.65 | -514.17 | -100 | -100 | -100 | -100 | -100 |
| Total Cash | 547.9 | 96.5 | 2,551.2 | 1,665.8 | 1,196.4 | 363.2 | 660.2 | 1,200.3 | 2,182.0 | 3,966.6 |
| Total Cash, percent | .0 | .0 | .0 | .0 | .0 | .0 | .0 | .0 | .0 | .0 |
| Account Receivables | 59.6 | 60.4 | 107.0 | 160.7 | 138.4 | 340.9 | 619.7 | 1,126.5 | 2,047.9 | 3,722.8 |
| Account Receivables, % | 1123.42 | 372 | 386 | 125.68 | 69.27 | 93.85 | 93.85 | 93.85 | 93.85 | 93.85 |
| Inventories | 34.8 | 40.1 | 79.0 | 159.3 | 211.7 | 363.2 | 660.2 | 1,200.3 | 2,182.0 | 3,966.6 |
| Inventories, % | 656.19 | 247.17 | 285.09 | 124.61 | 105.96 | 100 | 100 | 100 | 100 | 100 |
| Accounts Payable | 22.6 | 39.7 | 45.2 | 62.3 | 100.2 | 289.8 | 526.8 | 957.6 | 1,740.9 | 3,164.7 |
| Accounts Payable, % | 425.57 | 244.6 | 163.05 | 48.75 | 50.17 | 79.78 | 79.78 | 79.78 | 79.78 | 79.78 |
| Capital Expenditure | -130.6 | -217.5 | -545.0 | -499.9 | -330.1 | -363.2 | -660.2 | -1,200.3 | -2,182.0 | -3,966.6 |
| Capital Expenditure, % | -2463.5 | -1340.48 | -1965.36 | -391.06 | -165.21 | -100 | -100 | -100 | -100 | -100 |
| Tax Rate, % | 0.33913 | 0.33913 | 0.33913 | 0.33913 | 0.33913 | 0.33913 | 0.33913 | 0.33913 | 0.33913 | 0.33913 |
| EBITAT | -667.0 | -798.2 | -999.4 | -1,085.5 | -1,023.7 | -362.2 | -658.4 | -1,196.9 | -2,175.9 | -3,955.6 |
| Depreciation | ||||||||||
| Changes in Account Receivables | ||||||||||
| Changes in Inventories | ||||||||||
| Changes in Accounts Payable | ||||||||||
| Capital Expenditure | ||||||||||
| UFCF | -813.1 | -942.7 | -1,560.0 | -1,627.8 | -1,249.1 | -594.4 | -1,120.5 | -2,036.9 | -3,702.9 | -6,731.5 |
| WACC, % | 12.49 | 12.49 | 12.49 | 12.49 | 12.49 | 12.49 | 12.49 | 12.49 | 12.49 | 12.49 |
| PV UFCF | ||||||||||
| SUM PV UFCF | -8,894.2 | |||||||||
| Long Term Growth Rate, % | 2.00 | |||||||||
| Free cash flow (T + 1) | -6,866 | |||||||||
| Terminal Value | -65,448 | |||||||||
| Present Terminal Value | -36,333 | |||||||||
| Enterprise Value | -45,227 | |||||||||
| Net Debt | 878 | |||||||||
| Equity Value | -46,106 | |||||||||
| Diluted Shares Outstanding, MM | 400 | |||||||||
| Equity Value Per Share | -115.27 |
What You Will Receive
- Customizable Excel Template: A fully adjustable Excel-based DCF Calculator featuring pre-filled financial data for Mabwell (Shanghai) Bioscience Co., Ltd. (688062SS).
- Accurate Historical Data: Access past data and future projections, clearly indicated in the highlighted cells.
- Flexible Forecasting: Modify key assumptions such as revenue growth, EBITDA percentage, and WACC as needed.
- Instant Calculations: Quickly observe how changes in your inputs affect the valuation of Mabwell (Shanghai) Bioscience Co., Ltd. (688062SS).
- Professional-Grade Tool: Designed for investors, CFOs, consultants, and financial analysts in the biotech field.
- Intuitive User Interface: Optimized for simplicity and efficiency, complete with straightforward instructions.
Key Features of Mabwell (Shanghai) Bioscience Co., Ltd. (688062SS)
- Customizable Financial Inputs: Adjust essential parameters such as revenue projections, EBITDA margins, and investment costs.
- Instant DCF Valuation: Automatically computes intrinsic value, net present value, and additional metrics in real-time.
- High-Precision Accuracy: Leverages real-life financial data from Mabwell for credible valuation results.
- Effortless Scenario Analysis: Easily evaluate varying assumptions and analyze resulting outcomes.
- Efficiency Booster: Streamlines the valuation process, removing the need to create intricate models from the ground up.
How It Functions
- Download the Template: Gain immediate access to the Excel-based Mabwell (Shanghai) Bioscience Co., Ltd. (688062SS) DCF Calculator.
- Input Your Assumptions: Modify the yellow-highlighted cells to set parameters for growth rates, WACC, profit margins, and more.
- Instant Calculations: The model swiftly recalculates Mabwell’s intrinsic value.
- Test Scenarios: Experiment with various assumptions to assess potential changes in valuation.
- Analyze and Decide: Utilize the findings to inform your investment or financial analysis.
Why Choose This Calculator for Mabwell (688062SS)?
- Accurate Financials: Leverage real Mabwell data for trustworthy valuation outcomes.
- Highly Customizable: Tailor essential parameters like growth projections, discount rates, and tax assumptions to fit your analysis.
- Efficient: Pre-configured calculations save you time and effort, allowing for quicker insights.
- Professional Quality: Ideal for investors, financial analysts, and consulting professionals.
- User-Friendly Design: An intuitive interface with clear instructions makes it accessible for everyone.
Who Can Benefit from Our Solutions?
- Investors: Make informed decisions with our cutting-edge valuation tools tailored for the biotech industry.
- Financial Analysts: Enhance efficiency with our customizable financial models designed specifically for biotech companies.
- Consultants: Seamlessly adapt our resources for impactful client presentations or detailed reports.
- Biotech Enthusiasts: Expand your knowledge of valuation methods through practical, real-world examples in the life sciences sector.
- Educators and Students: Utilize our tools as effective learning aids in biomedical and finance courses.
Contents of the Template
- Comprehensive DCF Model: Editable template featuring detailed valuation calculations.
- Real-World Data: Mabwell (Shanghai) Bioscience Co., Ltd. (688062SS) historical and projected financials preloaded for in-depth analysis.
- Customizable Parameters: Modify WACC, growth rates, and tax assumptions to explore various scenarios.
- Financial Statements: Complete annual and quarterly breakdowns for enhanced insights.
- Key Ratios: Integrated analysis for profitability, efficiency, and leverage metrics.
- Dashboard with Visual Outputs: Charts and tables presenting clear, actionable results.
Disclaimer
All information, articles, and product details provided on this website are for general informational and educational purposes only. We do not claim any ownership over, nor do we intend to infringe upon, any trademarks, copyrights, logos, brand names, or other intellectual property mentioned or depicted on this site. Such intellectual property remains the property of its respective owners, and any references here are made solely for identification or informational purposes, without implying any affiliation, endorsement, or partnership.
We make no representations or warranties, express or implied, regarding the accuracy, completeness, or suitability of any content or products presented. Nothing on this website should be construed as legal, tax, investment, financial, medical, or other professional advice. In addition, no part of this site—including articles or product references—constitutes a solicitation, recommendation, endorsement, advertisement, or offer to buy or sell any securities, franchises, or other financial instruments, particularly in jurisdictions where such activity would be unlawful.
All content is of a general nature and may not address the specific circumstances of any individual or entity. It is not a substitute for professional advice or services. Any actions you take based on the information provided here are strictly at your own risk. You accept full responsibility for any decisions or outcomes arising from your use of this website and agree to release us from any liability in connection with your use of, or reliance upon, the content or products found herein.