
|
Sinopep-Alsino Bio Pharmaceutical Co., Ltd. (688076.SS) Évaluation DCF |
Entièrement Modifiable: Adapté À Vos Besoins Dans Excel Ou Sheets
Conception Professionnelle: Modèles Fiables Et Conformes Aux Normes Du Secteur
Pré-Construits Pour Une Utilisation Rapide Et Efficace
Compatible MAC/PC, entièrement débloqué
Aucune Expertise N'Est Requise; Facile À Suivre
Sinopep-Allsino Bio Pharmaceutical Co.,Ltd. (688076.SS) Bundle
Simplifier Sinopep-Alsino Bio Pharmaceutical Co., Ltd. Valation avec cette calculatrice DCF personnalisable! Doté de véritables interventions financières Sinopep-Alsino et de prévisions réglables, vous pouvez tester les scénarios et découvrir la juste valeur de Sinopep-Alsino en quelques minutes.
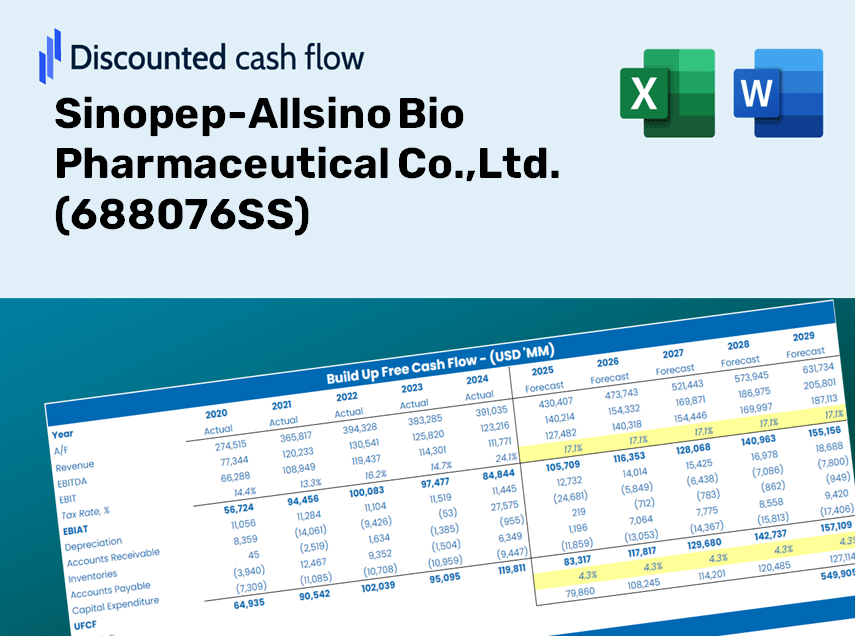
Discounted Cash Flow (DCF) - (USD MM)
| Year | AY1 2020 |
AY2 2021 |
AY3 2022 |
AY4 2023 |
AY5 2024 |
FY1 2025 |
FY2 2026 |
FY3 2027 |
FY4 2028 |
FY5 2029 |
|---|---|---|---|---|---|---|---|---|---|---|
| Revenue | 566.9 | 643.9 | 651.3 | 1,033.5 | 1,624.8 | 2,155.4 | 2,859.4 | 3,793.2 | 5,032.0 | 6,675.4 |
| Revenue Growth, % | 0 | 13.58 | 1.15 | 58.69 | 57.21 | 32.66 | 32.66 | 32.66 | 32.66 | 32.66 |
| EBITDA | 202.2 | 198.7 | 170.5 | 322.8 | 662.7 | 710.1 | 942.1 | 1,249.7 | 1,657.9 | 2,199.3 |
| EBITDA, % | 35.66 | 30.87 | 26.18 | 31.23 | 40.79 | 32.95 | 32.95 | 32.95 | 32.95 | 32.95 |
| Depreciation | 70.7 | 81.6 | 98.7 | 131.8 | 201.9 | 282.3 | 374.5 | 496.8 | 659.1 | 874.3 |
| Depreciation, % | 12.47 | 12.68 | 15.16 | 12.75 | 12.43 | 13.1 | 13.1 | 13.1 | 13.1 | 13.1 |
| EBIT | 131.5 | 117.1 | 71.8 | 191.0 | 460.9 | 427.8 | 567.6 | 752.9 | 998.8 | 1,325.0 |
| EBIT, % | 23.19 | 18.19 | 11.02 | 18.48 | 28.36 | 19.85 | 19.85 | 19.85 | 19.85 | 19.85 |
| Total Cash | 149.7 | 679.0 | 443.0 | 749.1 | 779.4 | 1,357.4 | 1,800.7 | 2,388.7 | 3,168.9 | 4,203.8 |
| Total Cash, percent | .0 | .0 | .0 | .0 | .0 | .0 | .0 | .0 | .0 | .0 |
| Account Receivables | 109.1 | 143.4 | 252.5 | 300.5 | 547.1 | 616.6 | 818.0 | 1,085.1 | 1,439.5 | 1,909.6 |
| Account Receivables, % | 19.25 | 22.27 | 38.77 | 29.08 | 33.67 | 28.61 | 28.61 | 28.61 | 28.61 | 28.61 |
| Inventories | 185.0 | 250.8 | 323.5 | 377.2 | 584.0 | 835.0 | 1,107.7 | 1,469.4 | 1,949.3 | 2,586.0 |
| Inventories, % | 32.63 | 38.95 | 49.67 | 36.49 | 35.95 | 38.74 | 38.74 | 38.74 | 38.74 | 38.74 |
| Accounts Payable | 105.4 | 76.9 | 66.6 | 126.7 | 393.5 | 333.0 | 441.8 | 586.0 | 777.4 | 1,031.3 |
| Accounts Payable, % | 18.6 | 11.95 | 10.23 | 12.26 | 24.22 | 15.45 | 15.45 | 15.45 | 15.45 | 15.45 |
| Capital Expenditure | -111.3 | -233.4 | -438.4 | -660.6 | -1,090.1 | -1,095.8 | -1,453.7 | -1,928.4 | -2,558.2 | -3,393.7 |
| Capital Expenditure, % | -19.63 | -36.24 | -67.31 | -63.92 | -67.09 | -50.84 | -50.84 | -50.84 | -50.84 | -50.84 |
| Tax Rate, % | 7.78 | 7.78 | 7.78 | 7.78 | 7.78 | 7.78 | 7.78 | 7.78 | 7.78 | 7.78 |
| EBITAT | 110.7 | 107.5 | 75.2 | 179.8 | 425.0 | 395.6 | 524.8 | 696.2 | 923.6 | 1,225.2 |
| Depreciation | ||||||||||
| Changes in Account Receivables | ||||||||||
| Changes in Inventories | ||||||||||
| Changes in Accounts Payable | ||||||||||
| Capital Expenditure | ||||||||||
| UFCF | -118.5 | -172.8 | -456.5 | -390.7 | -649.9 | -798.8 | -919.7 | -1,220.0 | -1,618.5 | -2,147.0 |
| WACC, % | 5.41 | 5.46 | 5.5 | 5.47 | 5.46 | 5.46 | 5.46 | 5.46 | 5.46 | 5.46 |
| PV UFCF | ||||||||||
| SUM PV UFCF | -5,578.7 | |||||||||
| Long Term Growth Rate, % | 2.00 | |||||||||
| Free cash flow (T + 1) | -2,190 | |||||||||
| Terminal Value | -63,289 | |||||||||
| Present Terminal Value | -48,516 | |||||||||
| Enterprise Value | -54,094 | |||||||||
| Net Debt | 943 | |||||||||
| Equity Value | -55,038 | |||||||||
| Diluted Shares Outstanding, MM | 220 | |||||||||
| Equity Value Per Share | -250.43 |
What You Will Receive
- Authentic Sinopep Data: Comprehensive financial information – from revenue to EBIT – derived from both actual and projected figures.
- Complete Customization: Modify all key parameters (yellow cells) such as WACC, growth rates, and tax percentages.
- Immediate Valuation Adjustments: Automatic recalculations to assess the effects of changes on Sinopep’s fair value.
- Flexible Excel Template: Designed for swift modifications, scenario analyses, and in-depth projections.
- Efficient and Precise: Avoid the hassle of creating models from scratch while preserving accuracy and adaptability.
Highlighted Features
- Accurate Financial Data: Gain access to reliable historical financials and forward-looking projections for Sinopep-Allsino Bio Pharmaceutical Co., Ltd. (688076SS).
- Tailorable Forecast Inputs: Modify highlighted fields such as WACC, growth rates, and profit margins to suit your analysis.
- Real-Time Calculations: Watch as DCF, Net Present Value (NPV), and cash flow analyses are automatically refreshed with new inputs.
- User-Friendly Dashboard: Intuitive charts and summaries that make it easy to interpret your valuation findings.
- Accessible for All Levels: Designed with simplicity in mind, suitable for investors, CFOs, and consultants alike.
How It Works
- Download: Obtain the ready-to-use Excel file containing Sinopep-Allsino Bio Pharmaceutical Co., Ltd.'s (688076SS) financial data.
- Customize: Modify forecasts, such as revenue growth, EBITDA %, and WACC as per your requirements.
- Update Automatically: Enjoy real-time updates on intrinsic value and NPV calculations.
- Test Scenarios: Generate various projections and analyze outcomes swiftly.
- Make Decisions: Leverage the valuation results to inform your investment strategy.
Why Choose This Calculator for Sinopep-Allsino Bio Pharmaceutical Co., Ltd. (688076SS)?
- User-Friendly Interface: Tailored for both novice users and experienced analysts.
- Customizable Parameters: Effortlessly adjust inputs to suit your financial analysis.
- Real-Time Adjustments: Observe immediate changes to Sinopep-Allsino's valuation with input modifications.
- Preloaded Financial Data: Comes equipped with Sinopep-Allsino's latest financial metrics for swift evaluations.
- Industry Endorsed: A preferred tool among investors and analysts for making well-informed choices.
Who Should Consider Sinopep-Allsino Bio Pharmaceutical Co., Ltd.?
- Individual Investors: Make informed investment choices regarding Sinopep-Allsino stock (688076SS).
- Financial Analysts: Enhance your valuation processes with ready-to-use financial models tailored to Sinopep-Allsino.
- Consultants: Provide clients with accurate and timely valuation insights on Sinopep-Allsino Bio Pharmaceutical Co., Ltd.
- Business Owners: Gain insights into the valuation of biopharmaceutical companies like Sinopep-Allsino to inform your strategic decisions.
- Finance Students: Acquire real-world valuation skills using data and scenarios related to Sinopep-Allsino (688076SS).
Contents of the Template
- Comprehensive DCF Model: An editable template featuring extensive valuation calculations.
- Real-World Data: Historical and projected financials for Sinopep-Allsino Bio Pharmaceutical Co.,Ltd. (688076SS) preloaded for in-depth analysis.
- Customizable Parameters: Tailor WACC, growth rates, and tax assumptions to explore various scenarios.
- Financial Statements: Detailed annual and quarterly breakdowns for enhanced insights.
- Key Ratios: Integrated analysis covering profitability, efficiency, and leverage metrics.
- Dashboard with Visual Outputs: A collection of charts and tables providing clear, actionable results.
Disclaimer
All information, articles, and product details provided on this website are for general informational and educational purposes only. We do not claim any ownership over, nor do we intend to infringe upon, any trademarks, copyrights, logos, brand names, or other intellectual property mentioned or depicted on this site. Such intellectual property remains the property of its respective owners, and any references here are made solely for identification or informational purposes, without implying any affiliation, endorsement, or partnership.
We make no representations or warranties, express or implied, regarding the accuracy, completeness, or suitability of any content or products presented. Nothing on this website should be construed as legal, tax, investment, financial, medical, or other professional advice. In addition, no part of this site—including articles or product references—constitutes a solicitation, recommendation, endorsement, advertisement, or offer to buy or sell any securities, franchises, or other financial instruments, particularly in jurisdictions where such activity would be unlawful.
All content is of a general nature and may not address the specific circumstances of any individual or entity. It is not a substitute for professional advice or services. Any actions you take based on the information provided here are strictly at your own risk. You accept full responsibility for any decisions or outcomes arising from your use of this website and agree to release us from any liability in connection with your use of, or reliance upon, the content or products found herein.