
|
Fujian Foxit Software Development Joint Stock Co., Ltd (688095.SS) Évaluation DCF |
Entièrement Modifiable: Adapté À Vos Besoins Dans Excel Ou Sheets
Conception Professionnelle: Modèles Fiables Et Conformes Aux Normes Du Secteur
Pré-Construits Pour Une Utilisation Rapide Et Efficace
Compatible MAC/PC, entièrement débloqué
Aucune Expertise N'Est Requise; Facile À Suivre
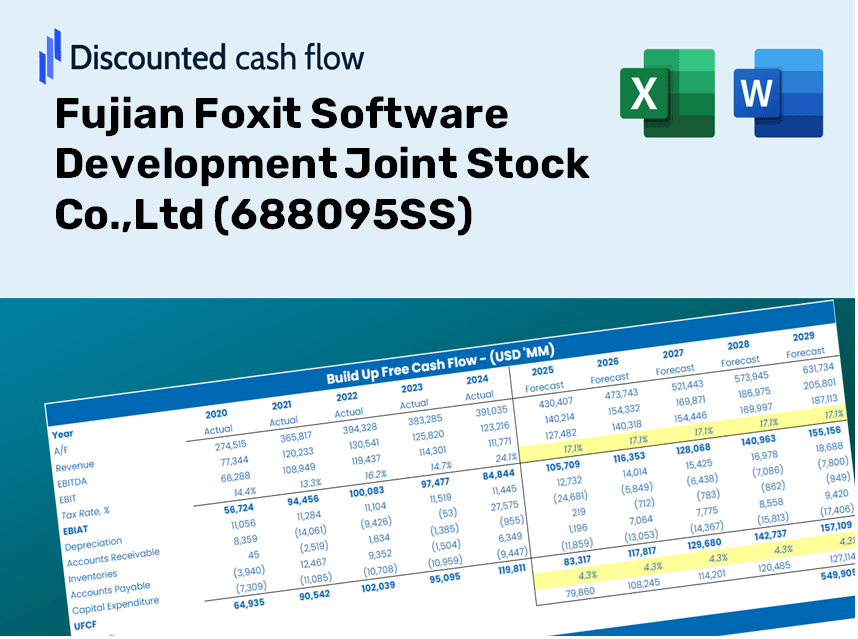
Fujian Foxit Software Development Joint Stock Co.,Ltd (688095.SS) Bundle
Évaluez les perspectives financières de Fujian Foxit Software Development Joint Stock Co., Ltd comme un expert! Ce calculatrice DCF (688095SS) fournit des détails financiers pré-remplis et une pleine flexibilité pour modifier la croissance des revenus, le WACC, les marges et d'autres hypothèses essentielles pour s'aligner sur vos prévisions.
What You Will Receive
- Actual FXT Financials: Provides historical and projected data for precise valuation.
- Customizable Inputs: Adjust WACC, tax rates, revenue growth, and capital expenditures to suit your needs.
- Dynamic Calculations: Instant calculations for intrinsic value and NPV.
- Scenario Simulation: Analyze various scenarios to assess the future performance of Fujian Foxit Software (688095SS).
- User-Friendly Design: Designed for industry professionals while remaining easy for newcomers to navigate.
Core Features
- Authentic Financial Data: Gain access to reliable pre-loaded historical figures and future forecasts for Fujian Foxit Software Development Joint Stock Co.,Ltd (688095SS).
- Adjustable Forecast Parameters: Modify yellow-highlighted cells, including WACC, growth rates, and margins to suit your analysis.
- Real-Time Calculations: Enjoy automatic updates to DCF, Net Present Value (NPV), and cash flow projections.
- Interactive Dashboard: User-friendly charts and summaries to help you visualize your valuation results effectively.
- Designed for Everyone: An intuitive layout tailored for investors, CFOs, and consultants, whether you're a novice or a seasoned professional.
How It Works
- Step 1: Download the prebuilt Excel template featuring Fujian Foxit Software's data.
- Step 2: Review the pre-filled sheets to familiarize yourself with essential metrics.
- Step 3: Adjust forecasts and assumptions in the editable yellow cells (WACC, growth, margins).
- Step 4: Instantly access recalculated results, including Fujian Foxit Software's intrinsic value.
- Step 5: Make well-informed investment decisions or create reports based on the generated outputs.
Why Opt for This Calculator?
- All-in-One Solution: Features DCF, WACC, and financial ratio analyses consolidated in a single tool.
- Flexible Customization: Easily modify the yellow-highlighted fields to explore different scenarios.
- In-Depth Analysis: Automatically computes Fujian Foxit's intrinsic value and Net Present Value.
- Loaded with Data: Includes both historical and projected data for precise baseline insights.
- High-Quality Standards: Tailored for financial analysts, investors, and business consultants.
Who Should Benefit from This Software?
- Tech Students: Master software development techniques and apply them to real-world projects.
- Researchers: Integrate advanced software models into academic studies or experiments.
- Developers: Validate your coding strategies and evaluate software performance metrics for Fujian Foxit Software (688095SS).
- Data Analysts: Enhance your efficiency with a ready-to-use, customizable analysis tool.
- Entrepreneurs: Understand how leading software companies like Fujian Foxit Software (688095SS) are evaluated in the market.
Components of the Template
- Operating and Balance Sheet Data: Pre-filled historical data and forecasts for Fujian Foxit Software Development Joint Stock Co., Ltd (688095SS), including revenue, EBITDA, EBIT, and capital expenditures.
- WACC Calculation: A dedicated sheet for calculating the Weighted Average Cost of Capital (WACC), featuring inputs such as Beta, risk-free rate, and share price.
- DCF Valuation (Unlevered and Levered): Customizable Discounted Cash Flow models that outline intrinsic value with comprehensive calculations.
- Financial Statements: Pre-loaded annual and quarterly financial statements to facilitate thorough analysis.
- Key Ratios: A set of key ratios including profitability, leverage, and efficiency metrics specific to Fujian Foxit Software Development Joint Stock Co., Ltd (688095SS).
- Dashboard and Charts: A visual summary of valuation outcomes and underlying assumptions, designed for straightforward result analysis.
Disclaimer
All information, articles, and product details provided on this website are for general informational and educational purposes only. We do not claim any ownership over, nor do we intend to infringe upon, any trademarks, copyrights, logos, brand names, or other intellectual property mentioned or depicted on this site. Such intellectual property remains the property of its respective owners, and any references here are made solely for identification or informational purposes, without implying any affiliation, endorsement, or partnership.
We make no representations or warranties, express or implied, regarding the accuracy, completeness, or suitability of any content or products presented. Nothing on this website should be construed as legal, tax, investment, financial, medical, or other professional advice. In addition, no part of this site—including articles or product references—constitutes a solicitation, recommendation, endorsement, advertisement, or offer to buy or sell any securities, franchises, or other financial instruments, particularly in jurisdictions where such activity would be unlawful.
All content is of a general nature and may not address the specific circumstances of any individual or entity. It is not a substitute for professional advice or services. Any actions you take based on the information provided here are strictly at your own risk. You accept full responsibility for any decisions or outcomes arising from your use of this website and agree to release us from any liability in connection with your use of, or reliance upon, the content or products found herein.