
|
Amlogic Co., Ltd. (688099.SS) Évaluation DCF |
Entièrement Modifiable: Adapté À Vos Besoins Dans Excel Ou Sheets
Conception Professionnelle: Modèles Fiables Et Conformes Aux Normes Du Secteur
Pré-Construits Pour Une Utilisation Rapide Et Efficace
Compatible MAC/PC, entièrement débloqué
Aucune Expertise N'Est Requise; Facile À Suivre
Amlogic (Shanghai) Co.,Ltd. (688099.SS) Bundle
Découvrez le véritable potentiel d'Amlogic (Shanghai) Co., Ltd. (688099SS) avec notre calculatrice avancée DCF! Personnalisez les hypothèses essentielles, explorez divers scénarios et évaluez comment les ajustements affectent Amlogic (Shanghai) Co., Ltd. (688099SS) Valation - le tout dans un modèle Excel pratique.
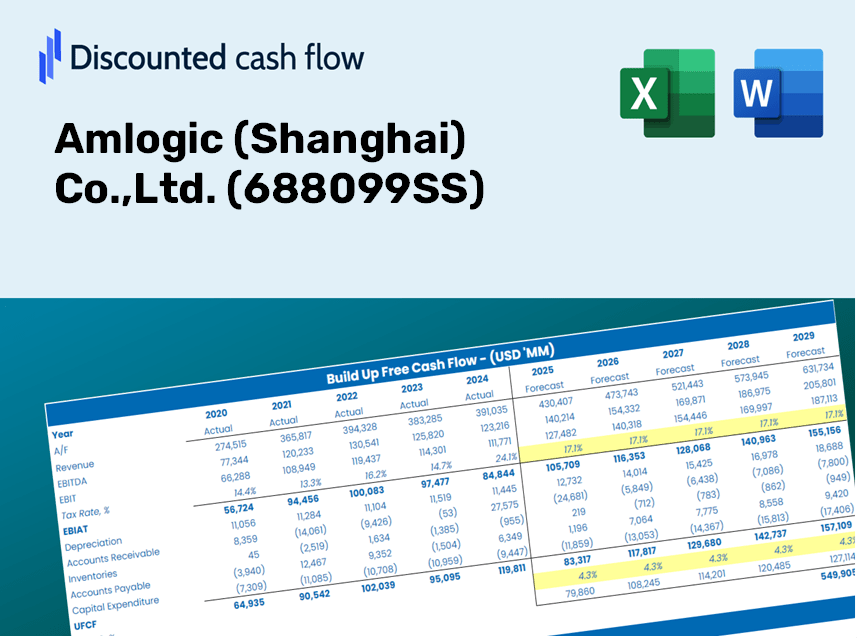
Discounted Cash Flow (DCF) - (USD MM)
| Year | AY1 2020 |
AY2 2021 |
AY3 2022 |
AY4 2023 |
AY5 2024 |
FY1 2025 |
FY2 2026 |
FY3 2027 |
FY4 2028 |
FY5 2029 |
|---|---|---|---|---|---|---|---|---|---|---|
| Revenue | 2,738.3 | 4,777.1 | 5,544.9 | 5,370.9 | 5,926.3 | 7,374.3 | 9,176.1 | 11,418.1 | 14,207.9 | 17,679.4 |
| Revenue Growth, % | 0 | 74.46 | 16.07 | -3.14 | 10.34 | 24.43 | 24.43 | 24.43 | 24.43 | 24.43 |
| EBITDA | 236.7 | 906.1 | 676.4 | 401.0 | 741.7 | 881.8 | 1,097.3 | 1,365.4 | 1,699.0 | 2,114.1 |
| EBITDA, % | 8.64 | 18.97 | 12.2 | 7.47 | 12.52 | 11.96 | 11.96 | 11.96 | 11.96 | 11.96 |
| Depreciation | 108.2 | 126.9 | 169.3 | 156.3 | 129.1 | 217.5 | 270.7 | 336.8 | 419.1 | 521.5 |
| Depreciation, % | 3.95 | 2.66 | 3.05 | 2.91 | 2.18 | 2.95 | 2.95 | 2.95 | 2.95 | 2.95 |
| EBIT | 128.5 | 779.2 | 507.1 | 244.7 | 612.6 | 664.3 | 826.6 | 1,028.6 | 1,279.9 | 1,592.6 |
| EBIT, % | 4.69 | 16.31 | 9.15 | 4.56 | 10.34 | 9.01 | 9.01 | 9.01 | 9.01 | 9.01 |
| Total Cash | 2,543.3 | 2,691.8 | 2,961.3 | 3,481.8 | 3,895.7 | 4,914.2 | 6,114.9 | 7,608.9 | 9,468.0 | 11,781.4 |
| Total Cash, percent | .0 | .0 | .0 | .0 | .0 | .0 | .0 | .0 | .0 | .0 |
| Account Receivables | 242.5 | 353.9 | 153.2 | 253.2 | 199.0 | 399.7 | 497.4 | 618.9 | 770.1 | 958.3 |
| Account Receivables, % | 8.86 | 7.41 | 2.76 | 4.71 | 3.36 | 5.42 | 5.42 | 5.42 | 5.42 | 5.42 |
| Inventories | 330.2 | 1,072.1 | 1,517.5 | 1,244.6 | 1,409.6 | 1,605.0 | 1,997.2 | 2,485.2 | 3,092.4 | 3,848.0 |
| Inventories, % | 12.06 | 22.44 | 27.37 | 23.17 | 23.79 | 21.77 | 21.77 | 21.77 | 21.77 | 21.77 |
| Accounts Payable | 407.6 | 610.6 | 410.7 | 357.5 | 386.7 | 711.7 | 885.6 | 1,101.9 | 1,371.2 | 1,706.2 |
| Accounts Payable, % | 14.88 | 12.78 | 7.41 | 6.66 | 6.53 | 9.65 | 9.65 | 9.65 | 9.65 | 9.65 |
| Capital Expenditure | -263.6 | -263.3 | -289.3 | -404.2 | -488.3 | -532.7 | -662.9 | -824.8 | -1,026.3 | -1,277.1 |
| Capital Expenditure, % | -9.63 | -5.51 | -5.22 | -7.53 | -8.24 | -7.22 | -7.22 | -7.22 | -7.22 | -7.22 |
| Tax Rate, % | 3.51 | 3.51 | 3.51 | 3.51 | 3.51 | 3.51 | 3.51 | 3.51 | 3.51 | 3.51 |
| EBITAT | 124.2 | 747.0 | 511.1 | 242.3 | 591.1 | 648.4 | 806.9 | 1,004.0 | 1,249.3 | 1,554.5 |
| Depreciation | ||||||||||
| Changes in Account Receivables | ||||||||||
| Changes in Inventories | ||||||||||
| Changes in Accounts Payable | ||||||||||
| Capital Expenditure | ||||||||||
| UFCF | -196.3 | -39.6 | -53.5 | 114.2 | 150.3 | 262.1 | 98.7 | 122.8 | 152.9 | 190.2 |
| WACC, % | 9.4 | 9.4 | 9.4 | 9.4 | 9.4 | 9.4 | 9.4 | 9.4 | 9.4 | 9.4 |
| PV UFCF | ||||||||||
| SUM PV UFCF | 643.9 | |||||||||
| Long Term Growth Rate, % | 4.00 | |||||||||
| Free cash flow (T + 1) | 198 | |||||||||
| Terminal Value | 3,660 | |||||||||
| Present Terminal Value | 2,335 | |||||||||
| Enterprise Value | 2,979 | |||||||||
| Net Debt | -2,941 | |||||||||
| Equity Value | 5,920 | |||||||||
| Diluted Shares Outstanding, MM | 419 | |||||||||
| Equity Value Per Share | 14.12 |
What You Will Receive
- Flexible Forecast Inputs: Effortlessly adjust key assumptions (growth %, margins, WACC) to model various scenarios.
- Industry-Specific Data: Amlogic’s financial information pre-loaded to accelerate your evaluation process.
- Instant DCF Calculations: The template automatically computes Net Present Value (NPV) and intrinsic value for you.
- Tailored and Professional Design: A refined Excel model that can be customized to meet your valuation requirements.
- Engineered for Analysts and Investors: Perfect for assessing forecasts, confirming strategies, and enhancing efficiency.
Highlighted Features
- Customizable Input Variables: Adjust essential elements such as revenue growth, EBITDA %, and capital expenditures.
- Instant DCF Valuation: Quickly computes intrinsic value, NPV, and other key metrics.
- High-Precision Accuracy: Leverages Amlogic’s real-world financial data for credible valuation results.
- Streamlined Scenario Analysis: Effortlessly evaluate various assumptions and juxtapose outcomes.
- Efficiency Boost: Say goodbye to the hassle of constructing intricate valuation models from the ground up.
How It Functions
- 1. Access the Template: Download and open the Excel file containing Amlogic’s preloaded data.
- 2. Modify Assumptions: Adjust essential inputs such as growth rates, WACC, and capital expenditures.
- 3. View Results in Real-Time: The DCF model automatically calculates intrinsic value and NPV.
- 4. Explore Different Scenarios: Analyze various forecasts to assess distinct valuation outcomes.
- 5. Present with Assurance: Share professional valuation insights to inform your decisions regarding Amlogic (688099SS).
Why Select This Amlogic Calculator?
- Precision: Real Amlogic financials guarantee data integrity.
- Adaptability: Built for users to easily experiment with and adjust inputs.
- Efficiency: Avoid the complexity of creating a DCF model from the ground up.
- Professional-Quality: Crafted with the accuracy and usability expected by CFOs.
- Intuitive: Simple to operate, even for those lacking advanced financial modeling skills.
Who Can Benefit from Amlogic (Shanghai) Co., Ltd. (688099SS)?
- Finance Students: Master valuation methodologies and practice them with actual market data.
- Academics: Integrate cutting-edge financial models into your teaching or scholarly research.
- Investors: Validate your investment strategies and examine valuation results for Amlogic (688099SS).
- Analysts: Enhance your efficiency with a ready-made, adaptable DCF model tailored for Amlogic.
- Small Business Owners: Discover how major public firms like Amlogic are evaluated in the financial landscape.
Contents of the Template
- Operating and Balance Sheet Data: Pre-filled historical data and forecasts for Amlogic (Shanghai) Co., Ltd. (688099SS), including revenue, EBITDA, EBIT, and capital expenditures.
- WACC Calculation: A dedicated sheet for Weighted Average Cost of Capital (WACC), featuring parameters such as Beta, risk-free rate, and share price.
- DCF Valuation (Unlevered and Levered): Customizable Discounted Cash Flow models that display intrinsic value along with comprehensive calculations.
- Financial Statements: Pre-loaded financial statements (annual and quarterly) to facilitate in-depth analysis.
- Key Ratios: Includes profitability, leverage, and efficiency ratios specific to Amlogic (Shanghai) Co., Ltd. (688099SS).
- Dashboard and Charts: Visual overview of valuation outputs and assumptions for straightforward result analysis.
Disclaimer
All information, articles, and product details provided on this website are for general informational and educational purposes only. We do not claim any ownership over, nor do we intend to infringe upon, any trademarks, copyrights, logos, brand names, or other intellectual property mentioned or depicted on this site. Such intellectual property remains the property of its respective owners, and any references here are made solely for identification or informational purposes, without implying any affiliation, endorsement, or partnership.
We make no representations or warranties, express or implied, regarding the accuracy, completeness, or suitability of any content or products presented. Nothing on this website should be construed as legal, tax, investment, financial, medical, or other professional advice. In addition, no part of this site—including articles or product references—constitutes a solicitation, recommendation, endorsement, advertisement, or offer to buy or sell any securities, franchises, or other financial instruments, particularly in jurisdictions where such activity would be unlawful.
All content is of a general nature and may not address the specific circumstances of any individual or entity. It is not a substitute for professional advice or services. Any actions you take based on the information provided here are strictly at your own risk. You accept full responsibility for any decisions or outcomes arising from your use of this website and agree to release us from any liability in connection with your use of, or reliance upon, the content or products found herein.