
|
Giantec Semiconductor Corporation (688123.SS) Évaluation DCF |
Entièrement Modifiable: Adapté À Vos Besoins Dans Excel Ou Sheets
Conception Professionnelle: Modèles Fiables Et Conformes Aux Normes Du Secteur
Pré-Construits Pour Une Utilisation Rapide Et Efficace
Compatible MAC/PC, entièrement débloqué
Aucune Expertise N'Est Requise; Facile À Suivre
Giantec Semiconductor Corporation (688123.SS) Bundle
Conçu pour la précision, notre calculatrice DCF (688123SS) vous permet d'évaluer l'évaluation de Giantec Semiconductor Corporation à l'aide d'informations financières réelles, offrant une flexibilité complète pour modifier tous les paramètres essentiels pour des projections améliorées.
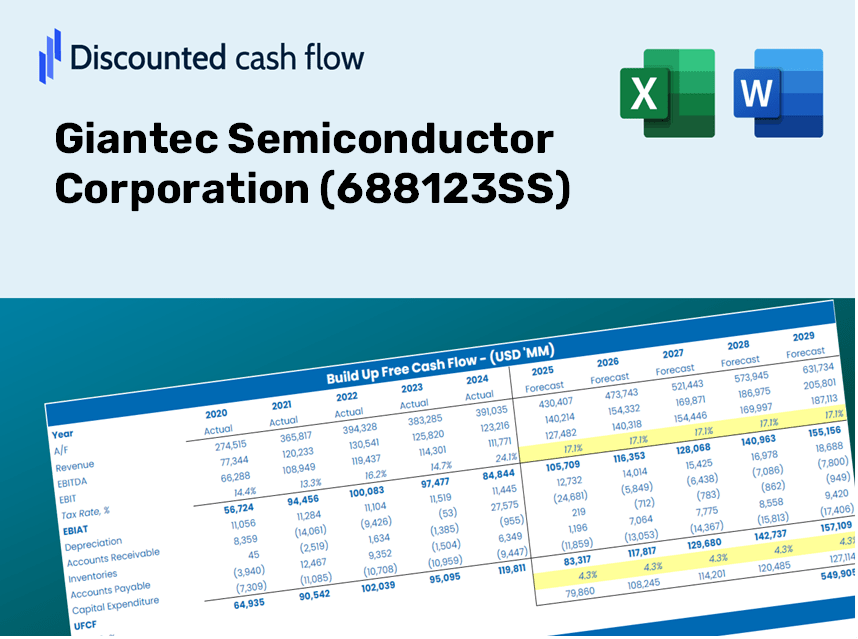
Discounted Cash Flow (DCF) - (USD MM)
| Year | AY1 2020 |
AY2 2021 |
AY3 2022 |
AY4 2023 |
AY5 2024 |
FY1 2025 |
FY2 2026 |
FY3 2027 |
FY4 2028 |
FY5 2029 |
|---|---|---|---|---|---|---|---|---|---|---|
| Revenue | 493.9 | 544.1 | 980.4 | 703.5 | 1,028.3 | 1,306.7 | 1,660.4 | 2,110.0 | 2,681.3 | 3,407.2 |
| Revenue Growth, % | 0 | 10.17 | 80.21 | -28.25 | 46.17 | 27.07 | 27.07 | 27.07 | 27.07 | 27.07 |
| EBITDA | 69.8 | 85.2 | 395.7 | 69.9 | 267.4 | 277.2 | 352.3 | 447.7 | 568.9 | 722.9 |
| EBITDA, % | 14.13 | 15.66 | 40.36 | 9.93 | 26 | 21.22 | 21.22 | 21.22 | 21.22 | 21.22 |
| Depreciation | .8 | 3.2 | 5.3 | 10.7 | 12.8 | 10.6 | 13.5 | 17.1 | 21.8 | 27.7 |
| Depreciation, % | 0.16987 | 0.58369 | 0.53922 | 1.52 | 1.24 | 0.81179 | 0.81179 | 0.81179 | 0.81179 | 0.81179 |
| EBIT | 68.9 | 82.0 | 390.5 | 59.2 | 254.6 | 266.6 | 338.8 | 430.5 | 547.1 | 695.2 |
| EBIT, % | 13.96 | 15.08 | 39.83 | 8.41 | 24.76 | 20.4 | 20.4 | 20.4 | 20.4 | 20.4 |
| Total Cash | 1,362.3 | 1,206.5 | 1,387.4 | 1,309.1 | 1,456.1 | 1,306.7 | 1,660.4 | 2,110.0 | 2,681.3 | 3,407.2 |
| Total Cash, percent | .0 | .0 | .0 | .0 | .0 | .0 | .0 | .0 | .0 | .0 |
| Account Receivables | 115.7 | 103.7 | 160.1 | 144.0 | 142.8 | 243.5 | 309.4 | 393.2 | 499.6 | 634.9 |
| Account Receivables, % | 23.42 | 19.07 | 16.33 | 20.47 | 13.89 | 18.63 | 18.63 | 18.63 | 18.63 | 18.63 |
| Inventories | 66.5 | 100.6 | 211.9 | 225.2 | 243.4 | 285.5 | 362.9 | 461.1 | 585.9 | 744.6 |
| Inventories, % | 13.47 | 18.5 | 21.62 | 32.01 | 23.67 | 21.85 | 21.85 | 21.85 | 21.85 | 21.85 |
| Accounts Payable | 57.2 | 59.8 | 54.0 | 65.6 | 65.0 | 114.2 | 145.2 | 184.5 | 234.4 | 297.9 |
| Accounts Payable, % | 11.57 | 10.99 | 5.51 | 9.32 | 6.32 | 8.74 | 8.74 | 8.74 | 8.74 | 8.74 |
| Capital Expenditure | -20.8 | -172.1 | -49.4 | -33.1 | -48.1 | -131.4 | -166.9 | -212.1 | -269.6 | -342.5 |
| Capital Expenditure, % | -4.21 | -31.64 | -5.04 | -4.7 | -4.68 | -10.05 | -10.05 | -10.05 | -10.05 | -10.05 |
| Tax Rate, % | 2.78 | 2.78 | 2.78 | 2.78 | 2.78 | 2.78 | 2.78 | 2.78 | 2.78 | 2.78 |
| EBITAT | 63.3 | 78.4 | 360.4 | 70.1 | 247.5 | 254.3 | 323.1 | 410.6 | 521.8 | 663.0 |
| Depreciation | ||||||||||
| Changes in Account Receivables | ||||||||||
| Changes in Inventories | ||||||||||
| Changes in Accounts Payable | ||||||||||
| Capital Expenditure | ||||||||||
| UFCF | -81.7 | -110.2 | 142.9 | 62.2 | 194.5 | 40.0 | 57.4 | 72.9 | 92.6 | 117.7 |
| WACC, % | 9.69 | 9.69 | 9.69 | 9.69 | 9.69 | 9.69 | 9.69 | 9.69 | 9.69 | 9.69 |
| PV UFCF | ||||||||||
| SUM PV UFCF | 277.4 | |||||||||
| Long Term Growth Rate, % | 2.00 | |||||||||
| Free cash flow (T + 1) | 120 | |||||||||
| Terminal Value | 1,561 | |||||||||
| Present Terminal Value | 983 | |||||||||
| Enterprise Value | 1,260 | |||||||||
| Net Debt | -573 | |||||||||
| Equity Value | 1,833 | |||||||||
| Diluted Shares Outstanding, MM | 159 | |||||||||
| Equity Value Per Share | 11.52 |
What You Will Gain
- Authentic Giantec Financial Data: Access to both historical and projected data for precise valuation.
- Customizable Inputs: Adjust WACC, tax rates, revenue growth, and capital expenditures to fit your analysis.
- Automated Calculations: Dynamic computation of intrinsic value and NPV.
- Scenario Testing: Explore various scenarios to assess Giantec's potential future performance.
- User-Friendly Design: Crafted for professionals while remaining approachable for newcomers.
Key Features
- 🔍 Real-Life Giantec Semiconductor Financials: Pre-filled historical and projected data for Giantec Semiconductor Corporation (688123SS).
- ✏️ Fully Customizable Inputs: Adjust all critical parameters (yellow cells) such as WACC, growth %, and tax rates.
- 📊 Professional DCF Valuation: Built-in formulas calculate Giantec's intrinsic value using the Discounted Cash Flow method.
- ⚡ Instant Results: Visualize Giantec's valuation instantly after making adjustments.
- Scenario Analysis: Test and compare outcomes for various financial assumptions side-by-side.
How It Works
- 1. Open the Template: Download and access the Excel file containing Giantec Semiconductor Corporation's (688123SS) preloaded data.
- 2. Edit Assumptions: Modify essential inputs such as growth rates, WACC, and capital expenditures as per your analysis.
- 3. View Results Instantly: The DCF model rapidly calculates intrinsic value and NPV based on your adjustments.
- 4. Test Scenarios: Analyze various forecasts to evaluate different valuation scenarios.
- 5. Use with Confidence: Present professional valuation insights for Giantec Semiconductor Corporation (688123SS) to inform your strategic decisions.
Why Choose the Giantec Semiconductor Calculator?
- Designed for Professionals: A sophisticated tool leveraged by analysts, CFOs, and industry consultants.
- Accurate Data Insights: Giantec’s historical and projected financial information is preloaded for precision.
- Scenario Analysis: Effortlessly simulate various forecasts and assumptions.
- Comprehensive Outputs: Automatically computes intrinsic value, NPV, and essential financial metrics.
- User-Friendly: Clear, step-by-step guidance simplifies the entire process.
Who Can Benefit from Giantec Semiconductor Corporation?
- Individual Investors: Make educated choices regarding the purchase or sale of Giantec Semiconductor stock (688123SS).
- Financial Analysts: Enhance valuation methods with accessible financial models tailored for Giantec Semiconductor.
- Consultants: Provide clients with timely and accurate valuation analyses of Giantec Semiconductor.
- Business Owners: Gain insights into how major players like Giantec Semiconductor are valued to inform your own business strategies.
- Finance Students: Acquire valuation skills using current data and real-world case studies centered around Giantec Semiconductor.
Contents of the Template
- Pre-Filled DCF Model: Giantec Semiconductor Corporation’s financial data preloaded for immediate application.
- WACC Calculator: Comprehensive calculations for Weighted Average Cost of Capital.
- Financial Ratios: Assess Giantec’s profitability, leverage, and operational efficiency.
- Editable Inputs: Adjust assumptions such as growth, margins, and CAPEX to tailor your scenarios.
- Financial Statements: Access annual and quarterly reports for thorough analysis.
- Interactive Dashboard: Effortlessly visualize essential valuation metrics and outcomes.
Disclaimer
All information, articles, and product details provided on this website are for general informational and educational purposes only. We do not claim any ownership over, nor do we intend to infringe upon, any trademarks, copyrights, logos, brand names, or other intellectual property mentioned or depicted on this site. Such intellectual property remains the property of its respective owners, and any references here are made solely for identification or informational purposes, without implying any affiliation, endorsement, or partnership.
We make no representations or warranties, express or implied, regarding the accuracy, completeness, or suitability of any content or products presented. Nothing on this website should be construed as legal, tax, investment, financial, medical, or other professional advice. In addition, no part of this site—including articles or product references—constitutes a solicitation, recommendation, endorsement, advertisement, or offer to buy or sell any securities, franchises, or other financial instruments, particularly in jurisdictions where such activity would be unlawful.
All content is of a general nature and may not address the specific circumstances of any individual or entity. It is not a substitute for professional advice or services. Any actions you take based on the information provided here are strictly at your own risk. You accept full responsibility for any decisions or outcomes arising from your use of this website and agree to release us from any liability in connection with your use of, or reliance upon, the content or products found herein.