
|
Shanghai Haoyuan ChemExpress Co., Ltd. (688131.SS) Évaluation DCF |
Entièrement Modifiable: Adapté À Vos Besoins Dans Excel Ou Sheets
Conception Professionnelle: Modèles Fiables Et Conformes Aux Normes Du Secteur
Pré-Construits Pour Une Utilisation Rapide Et Efficace
Compatible MAC/PC, entièrement débloqué
Aucune Expertise N'Est Requise; Facile À Suivre
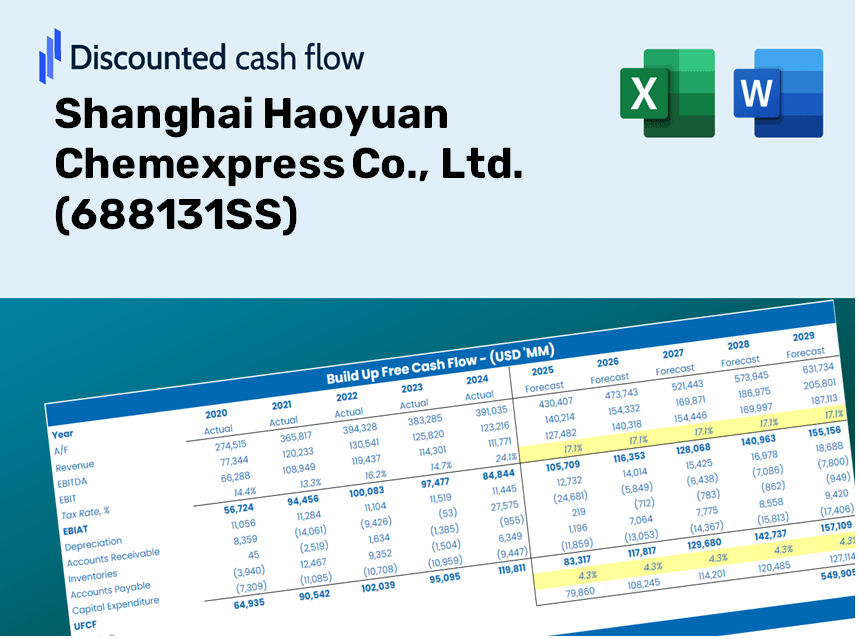
Shanghai Haoyuan Chemexpress Co., Ltd. (688131.SS) Bundle
Explorez les perspectives financières de Shanghai Haoyuan ChemExpress Co., Ltd. (688131SS) avec notre calculatrice DCF conviviale! Entrez vos hypothèses concernant la croissance, les marges et les coûts pour déterminer la valeur intrinsèque de Shanghai Haoyuan ChemExpress Co., Ltd. (688131SS) et améliorez votre stratégie d'investissement.
Discounted Cash Flow (DCF) - (USD MM)
| Year | AY1 2020 |
AY2 2021 |
AY3 2022 |
AY4 2023 |
AY5 2024 |
FY1 2025 |
FY2 2026 |
FY3 2027 |
FY4 2028 |
FY5 2029 |
|---|---|---|---|---|---|---|---|---|---|---|
| Revenue | 635.1 | 969.2 | 1,358.1 | 1,880.0 | 2,270.2 | 3,132.4 | 4,322.0 | 5,963.4 | 8,228.3 | 11,353.3 |
| Revenue Growth, % | 0 | 52.61 | 40.12 | 38.44 | 20.75 | 37.98 | 37.98 | 37.98 | 37.98 | 37.98 |
| EBITDA | 153.7 | 217.6 | 195.2 | 232.0 | 382.0 | 565.0 | 779.6 | 1,075.7 | 1,484.3 | 2,048.0 |
| EBITDA, % | 24.2 | 22.45 | 14.38 | 12.34 | 16.83 | 18.04 | 18.04 | 18.04 | 18.04 | 18.04 |
| Depreciation | 7.7 | 15.8 | 36.5 | 83.4 | 118.6 | 95.2 | 131.3 | 181.2 | 250.0 | 345.0 |
| Depreciation, % | 1.22 | 1.63 | 2.69 | 4.44 | 5.22 | 3.04 | 3.04 | 3.04 | 3.04 | 3.04 |
| EBIT | 146.0 | 201.8 | 158.7 | 148.6 | 263.4 | 469.9 | 648.3 | 894.5 | 1,234.3 | 1,703.0 |
| EBIT, % | 22.99 | 20.82 | 11.69 | 7.9 | 11.6 | 15 | 15 | 15 | 15 | 15 |
| Total Cash | 292.0 | 1,037.2 | 477.4 | 483.6 | 1,328.7 | 1,662.6 | 2,294.0 | 3,165.2 | 4,367.3 | 6,025.9 |
| Total Cash, percent | .0 | .0 | .0 | .0 | .0 | .0 | .0 | .0 | .0 | .0 |
| Account Receivables | 101.7 | 150.8 | 366.0 | 485.7 | 628.8 | 702.0 | 968.6 | 1,336.4 | 1,843.9 | 2,544.2 |
| Account Receivables, % | 16.01 | 15.56 | 26.95 | 25.83 | 27.7 | 22.41 | 22.41 | 22.41 | 22.41 | 22.41 |
| Inventories | 228.7 | 352.1 | 910.9 | 1,145.5 | 1,162.6 | 1,575.8 | 2,174.3 | 3,000.1 | 4,139.5 | 5,711.7 |
| Inventories, % | 36.01 | 36.33 | 67.07 | 60.93 | 51.21 | 50.31 | 50.31 | 50.31 | 50.31 | 50.31 |
| Accounts Payable | 102.8 | 206.3 | 310.0 | 293.4 | 337.8 | 568.7 | 784.7 | 1,082.8 | 1,494.0 | 2,061.4 |
| Accounts Payable, % | 16.19 | 21.28 | 22.82 | 15.61 | 14.88 | 18.16 | 18.16 | 18.16 | 18.16 | 18.16 |
| Capital Expenditure | -71.2 | -287.7 | -581.4 | -259.8 | -304.5 | -694.9 | -958.8 | -1,323.0 | -1,825.4 | -2,518.7 |
| Capital Expenditure, % | -11.2 | -29.68 | -42.81 | -13.82 | -13.41 | -22.18 | -22.18 | -22.18 | -22.18 | -22.18 |
| Tax Rate, % | 15.42 | 15.42 | 15.42 | 15.42 | 15.42 | 15.42 | 15.42 | 15.42 | 15.42 | 15.42 |
| EBITAT | 126.2 | 183.9 | 154.8 | 147.8 | 222.8 | 431.4 | 595.3 | 821.4 | 1,133.3 | 1,563.7 |
| Depreciation | ||||||||||
| Changes in Account Receivables | ||||||||||
| Changes in Inventories | ||||||||||
| Changes in Accounts Payable | ||||||||||
| Capital Expenditure | ||||||||||
| UFCF | -164.8 | -157.1 | -1,060.4 | -399.4 | -78.9 | -423.8 | -881.3 | -1,216.0 | -1,677.8 | -2,315.0 |
| WACC, % | 7 | 7.02 | 7.04 | 7.05 | 6.99 | 7.02 | 7.02 | 7.02 | 7.02 | 7.02 |
| PV UFCF | ||||||||||
| SUM PV UFCF | -5,085.8 | |||||||||
| Long Term Growth Rate, % | 4.00 | |||||||||
| Free cash flow (T + 1) | -2,408 | |||||||||
| Terminal Value | -79,748 | |||||||||
| Present Terminal Value | -56,808 | |||||||||
| Enterprise Value | -61,894 | |||||||||
| Net Debt | 906 | |||||||||
| Equity Value | -62,800 | |||||||||
| Diluted Shares Outstanding, MM | 210 | |||||||||
| Equity Value Per Share | -299.06 |
What You Will Receive
- Pre-Filled Financial Model: Leverage Shanghai Haoyuan Chemexpress Co., Ltd.'s actual data for accurate DCF valuation.
- Comprehensive Forecast Control: Modify revenue growth rates, profit margins, WACC, and other critical variables.
- Real-Time Calculations: Updates occur automatically, allowing you to view results as adjustments are made.
- Investor-Ready Template: A polished Excel file crafted for high-quality valuation presentations.
- Customizable and Reusable: Designed for versatility, facilitating repeated use for in-depth financial forecasts.
Key Features
- Comprehensive DCF Calculator: Features detailed unlevered and levered DCF valuation models tailored for Shanghai Haoyuan Chemexpress Co., Ltd. (688131SS).
- WACC Calculator: Pre-designed Weighted Average Cost of Capital spreadsheet with customizable parameters.
- Customizable Forecast Assumptions: Adjust growth projections, capital investments, and discount rates as needed.
- Integrated Financial Ratios: Evaluate profitability, leverage, and efficiency ratios specific to Shanghai Haoyuan Chemexpress Co., Ltd. (688131SS).
- Interactive Dashboard and Charts: Visual representations provide a concise summary of key valuation metrics for straightforward analysis.
How It Works
- Step 1: Download the Excel file.
- Step 2: Examine the pre-filled data for Shanghai Haoyuan Chemexpress Co., Ltd. (688131SS) including historical and forecasted figures.
- Step 3: Modify key assumptions (highlighted in yellow) based on your analysis.
- Step 4: Observe automatic recalculations for the intrinsic value of Shanghai Haoyuan Chemexpress Co., Ltd. (688131SS).
- Step 5: Utilize the results for making informed investment decisions or for reporting purposes.
Why Choose Our Calculator for Shanghai Haoyuan Chemexpress Co., Ltd. (688131SS)?
- Designed for Industry Experts: A sophisticated tool tailored for analysts, CFOs, and industry consultants.
- Comprehensive Data: Historical and forecasted financial information for Shanghai Haoyuan Chemexpress preloaded for precision.
- Versatile Scenario Analysis: Effortlessly simulate various forecasts and assumptions to explore different outcomes.
- Insightful Outputs: Automatically computes intrinsic value, NPV, and other essential metrics.
- User-Friendly Interface: Clear, step-by-step instructions to facilitate your calculations.
Who Should Utilize Our Services?
- Chemistry Students: Discover advanced chemical analysis techniques and apply them to actual case studies.
- Researchers: Integrate industry-standard models into your studies or academic projects.
- Investors: Validate your investment hypotheses and examine market trends for Shanghai Haoyuan Chemexpress Co., Ltd. (688131SS).
- Industry Analysts: Enhance your efficiency with our customizable chemical data models.
- Entrepreneurs: Understand how large chemical companies like Shanghai Haoyuan Chemexpress Co., Ltd. (688131SS) approach market analysis.
Overview of Template Components
- Historical Data: Provides past financial performance and baseline forecasts for Shanghai Haoyuan Chemexpress Co., Ltd. (688131SS).
- DCF and Levered DCF Models: Comprehensive templates for estimating the intrinsic value of Shanghai Haoyuan Chemexpress Co., Ltd. (688131SS).
- WACC Sheet: Pre-configured calculations for the Weighted Average Cost of Capital relevant to Shanghai Haoyuan Chemexpress Co., Ltd. (688131SS).
- Editable Inputs: Ability to adjust key parameters such as growth rates, EBITDA %, and CAPEX assumptions.
- Quarterly and Annual Statements: An exhaustive analysis of the financial statements for Shanghai Haoyuan Chemexpress Co., Ltd. (688131SS).
- Interactive Dashboard: A dynamic interface to visualize valuation results and future projections.
Disclaimer
All information, articles, and product details provided on this website are for general informational and educational purposes only. We do not claim any ownership over, nor do we intend to infringe upon, any trademarks, copyrights, logos, brand names, or other intellectual property mentioned or depicted on this site. Such intellectual property remains the property of its respective owners, and any references here are made solely for identification or informational purposes, without implying any affiliation, endorsement, or partnership.
We make no representations or warranties, express or implied, regarding the accuracy, completeness, or suitability of any content or products presented. Nothing on this website should be construed as legal, tax, investment, financial, medical, or other professional advice. In addition, no part of this site—including articles or product references—constitutes a solicitation, recommendation, endorsement, advertisement, or offer to buy or sell any securities, franchises, or other financial instruments, particularly in jurisdictions where such activity would be unlawful.
All content is of a general nature and may not address the specific circumstances of any individual or entity. It is not a substitute for professional advice or services. Any actions you take based on the information provided here are strictly at your own risk. You accept full responsibility for any decisions or outcomes arising from your use of this website and agree to release us from any liability in connection with your use of, or reliance upon, the content or products found herein.