
|
Shanghai Prisemi Electronics Co., Ltd. (688230.SS) Évaluation DCF |
Entièrement Modifiable: Adapté À Vos Besoins Dans Excel Ou Sheets
Conception Professionnelle: Modèles Fiables Et Conformes Aux Normes Du Secteur
Pré-Construits Pour Une Utilisation Rapide Et Efficace
Compatible MAC/PC, entièrement débloqué
Aucune Expertise N'Est Requise; Facile À Suivre
Shanghai Prisemi Electronics Co.,Ltd. (688230.SS) Bundle
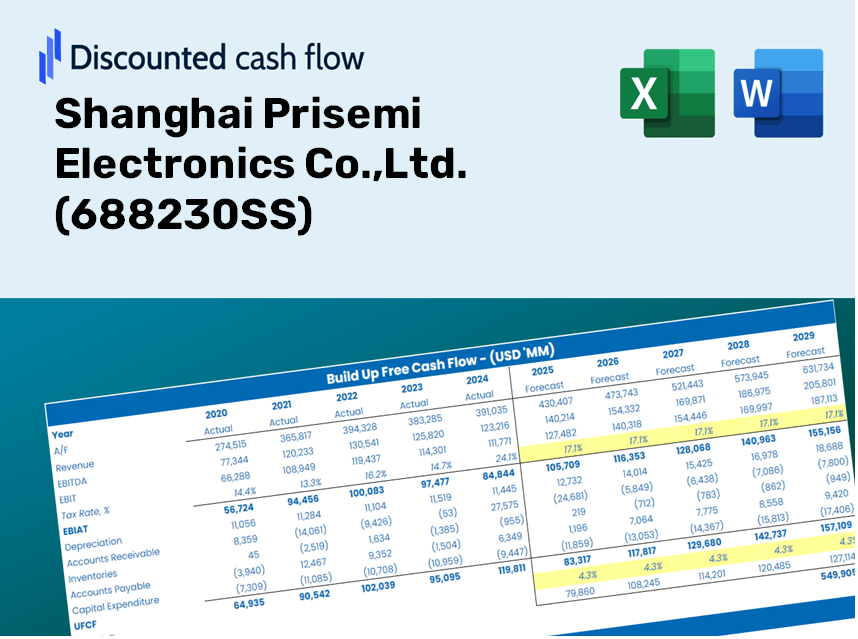
Simplifier Shanghai Prisemi Electronics Co., Ltd. (688230SS) Évaluation avec cette calculatrice DCF personnalisable! Avec Real Shanghai Prisemi Electronics Co., Ltd. (688230SS) Financials and Adjustable Prévision des entrées, vous pouvez tester des scénarios et découvrir Shanghai Prisemi Electronics Co., Ltd. (688230S) Juste valeur en minutes.
Discounted Cash Flow (DCF) - (USD MM)
| Year | AY1 2020 |
AY2 2021 |
AY3 2022 |
AY4 2023 |
AY5 2024 |
FY1 2025 |
FY2 2026 |
FY3 2027 |
FY4 2028 |
FY5 2029 |
|---|---|---|---|---|---|---|---|---|---|---|
| Revenue | 368.4 | 475.6 | 336.1 | 320.4 | 352.9 | 357.6 | 362.3 | 367.1 | 371.9 | 376.8 |
| Revenue Growth, % | 0 | 29.13 | -29.33 | -4.68 | 10.15 | 1.32 | 1.32 | 1.32 | 1.32 | 1.32 |
| EBITDA | 83.1 | 119.2 | 61.6 | 49.0 | 67.7 | 71.8 | 72.7 | 73.7 | 74.7 | 75.6 |
| EBITDA, % | 22.57 | 25.06 | 18.31 | 15.28 | 19.17 | 20.08 | 20.08 | 20.08 | 20.08 | 20.08 |
| Depreciation | 2.6 | 2.5 | 4.6 | 8.7 | 8.7 | 5.6 | 5.7 | 5.7 | 5.8 | 5.9 |
| Depreciation, % | 0.71381 | 0.53169 | 1.38 | 2.73 | 2.47 | 1.56 | 1.56 | 1.56 | 1.56 | 1.56 |
| EBIT | 80.5 | 116.7 | 56.9 | 40.2 | 58.9 | 66.2 | 67.1 | 68.0 | 68.8 | 69.8 |
| EBIT, % | 21.85 | 24.53 | 16.93 | 12.55 | 16.7 | 18.51 | 18.51 | 18.51 | 18.51 | 18.51 |
| Total Cash | 120.4 | 2,022.4 | 647.9 | 1,709.5 | 1,753.2 | 309.5 | 313.5 | 317.7 | 321.8 | 326.1 |
| Total Cash, percent | .0 | .0 | .0 | .0 | .0 | .0 | .0 | .0 | .0 | .0 |
| Account Receivables | 39.6 | 41.5 | 28.1 | 32.9 | 26.7 | 32.7 | 33.1 | 33.5 | 34.0 | 34.4 |
| Account Receivables, % | 10.75 | 8.73 | 8.36 | 10.27 | 7.58 | 9.14 | 9.14 | 9.14 | 9.14 | 9.14 |
| Inventories | 33.3 | 41.6 | 41.8 | 42.8 | 43.9 | 40.1 | 40.6 | 41.1 | 41.7 | 42.2 |
| Inventories, % | 9.04 | 8.74 | 12.45 | 13.36 | 12.43 | 11.2 | 11.2 | 11.2 | 11.2 | 11.2 |
| Accounts Payable | 58.2 | 43.5 | 26.4 | 41.3 | 43.9 | 41.6 | 42.1 | 42.7 | 43.2 | 43.8 |
| Accounts Payable, % | 15.79 | 9.15 | 7.85 | 12.88 | 12.45 | 11.62 | 11.62 | 11.62 | 11.62 | 11.62 |
| Capital Expenditure | -2.6 | -12.3 | -145.9 | -.9 | -2.9 | -34.2 | -34.6 | -35.1 | -35.6 | -36.0 |
| Capital Expenditure, % | -0.71579 | -2.59 | -43.41 | -0.29125 | -0.81345 | -9.56 | -9.56 | -9.56 | -9.56 | -9.56 |
| Tax Rate, % | 7.34 | 7.34 | 7.34 | 7.34 | 7.34 | 7.34 | 7.34 | 7.34 | 7.34 | 7.34 |
| EBITAT | 74.2 | 106.9 | 52.4 | 37.5 | 54.6 | 61.1 | 61.9 | 62.8 | 63.6 | 64.4 |
| Depreciation | ||||||||||
| Changes in Account Receivables | ||||||||||
| Changes in Inventories | ||||||||||
| Changes in Accounts Payable | ||||||||||
| Capital Expenditure | ||||||||||
| UFCF | 59.4 | 72.3 | -92.9 | 54.5 | 68.2 | 28.1 | 32.6 | 33.0 | 33.4 | 33.9 |
| WACC, % | 7.12 | 7.12 | 7.12 | 7.12 | 7.12 | 7.12 | 7.12 | 7.12 | 7.12 | 7.12 |
| PV UFCF | ||||||||||
| SUM PV UFCF | 130.8 | |||||||||
| Long Term Growth Rate, % | 2.00 | |||||||||
| Free cash flow (T + 1) | 35 | |||||||||
| Terminal Value | 674 | |||||||||
| Present Terminal Value | 478 | |||||||||
| Enterprise Value | 609 | |||||||||
| Net Debt | -53 | |||||||||
| Equity Value | 661 | |||||||||
| Diluted Shares Outstanding, MM | 118 | |||||||||
| Equity Value Per Share | 5.62 |
Benefits You Will Receive
- Customizable Forecast Inputs: Effortlessly adjust key assumptions (growth %, margins, WACC) to explore various scenarios.
- Market-Relevant Data: Shanghai Prisemi Electronics Co.,Ltd. financial data pre-loaded to facilitate your analysis.
- Instant DCF Calculations: The model automatically computes Net Present Value (NPV) and intrinsic value for your convenience.
- Professional and Adaptable: A refined Excel template designed to suit your valuation requirements.
- Designed for Analysts and Investors: Perfect for evaluating projections, reinforcing strategies, and maximizing efficiency.
Key Features
- Comprehensive DCF Calculator: Features detailed unlevered and levered DCF valuation models tailored for Shanghai Prisemi Electronics Co., Ltd. (688230SS).
- WACC Calculator: Pre-configured Weighted Average Cost of Capital sheet with adjustable parameters designed for customization.
- Customizable Forecast Inputs: Easily adjust growth rates, capital expenditures, and discount rates to fit your analysis.
- Integrated Financial Ratios: Examine profitability, leverage, and efficiency ratios specific to Shanghai Prisemi Electronics Co., Ltd. (688230SS).
- Interactive Dashboard and Charts: Visual representations that clearly highlight essential valuation metrics for straightforward assessment.
How It Functions
- Obtain the Template: Gain immediate access to the Excel-based Shanghai Prisemi Electronics Co., Ltd. DCF Calculator.
- Input Your Variables: Modify the yellow-highlighted cells for growth rates, WACC, profit margins, and additional factors.
- Immediate Calculations: The model automatically recalibrates the intrinsic value of Shanghai Prisemi Electronics Co., Ltd. (688230SS).
- Experiment with Scenarios: Test various assumptions to assess potential changes in valuation.
- Evaluate and Decide: Use the findings to inform your investment or financial evaluation.
Why Choose Shanghai Prisemi Electronics Co., Ltd. (688230SS)?
- Precision: Leverage accurate financial data specifically tailored for Prisemi.
- Adaptability: Our tool allows users to easily adjust and experiment with input values.
- Efficiency: Eliminate the need to create a financial model from the ground up.
- Expert-Designed: Crafted with the insights and standards of top-tier financial professionals.
- Intuitive Interface: Simple to navigate, making it accessible to users of all skill levels.
Who Can Benefit from This Product?
- Investors: Accurately assess the fair value of Shanghai Prisemi Electronics Co., Ltd. (688230SS) before making investment choices.
- CFOs: Utilize a professional-grade DCF model for comprehensive financial reporting and analysis.
- Consultants: Easily customize the template for client valuation reports.
- Entrepreneurs: Acquire insights into the financial modeling techniques employed by leading firms.
- Educators: Employ it as a teaching resource to illustrate various valuation methodologies.
Contents of the Template
- Historical Data: Comprises Shanghai Prisemi Electronics Co., Ltd.'s past financial performance and baseline forecasts.
- DCF and Levered DCF Models: Comprehensive templates for calculating the intrinsic value of Shanghai Prisemi Electronics Co., Ltd. (688230SS).
- WACC Sheet: Pre-configured calculations for the Weighted Average Cost of Capital.
- Editable Inputs: Adjust essential variables such as growth rates, EBITDA percentages, and CAPEX assumptions.
- Quarterly and Annual Statements: A thorough breakdown of Shanghai Prisemi Electronics Co., Ltd.'s financial data.
- Interactive Dashboard: Dynamically visualize valuation results and future projections.
Disclaimer
All information, articles, and product details provided on this website are for general informational and educational purposes only. We do not claim any ownership over, nor do we intend to infringe upon, any trademarks, copyrights, logos, brand names, or other intellectual property mentioned or depicted on this site. Such intellectual property remains the property of its respective owners, and any references here are made solely for identification or informational purposes, without implying any affiliation, endorsement, or partnership.
We make no representations or warranties, express or implied, regarding the accuracy, completeness, or suitability of any content or products presented. Nothing on this website should be construed as legal, tax, investment, financial, medical, or other professional advice. In addition, no part of this site—including articles or product references—constitutes a solicitation, recommendation, endorsement, advertisement, or offer to buy or sell any securities, franchises, or other financial instruments, particularly in jurisdictions where such activity would be unlawful.
All content is of a general nature and may not address the specific circumstances of any individual or entity. It is not a substitute for professional advice or services. Any actions you take based on the information provided here are strictly at your own risk. You accept full responsibility for any decisions or outcomes arising from your use of this website and agree to release us from any liability in connection with your use of, or reliance upon, the content or products found herein.