
|
China Southern Power Grid Technology Co., Ltd (688248.SS) Évaluation DCF |
Entièrement Modifiable: Adapté À Vos Besoins Dans Excel Ou Sheets
Conception Professionnelle: Modèles Fiables Et Conformes Aux Normes Du Secteur
Pré-Construits Pour Une Utilisation Rapide Et Efficace
Compatible MAC/PC, entièrement débloqué
Aucune Expertise N'Est Requise; Facile À Suivre
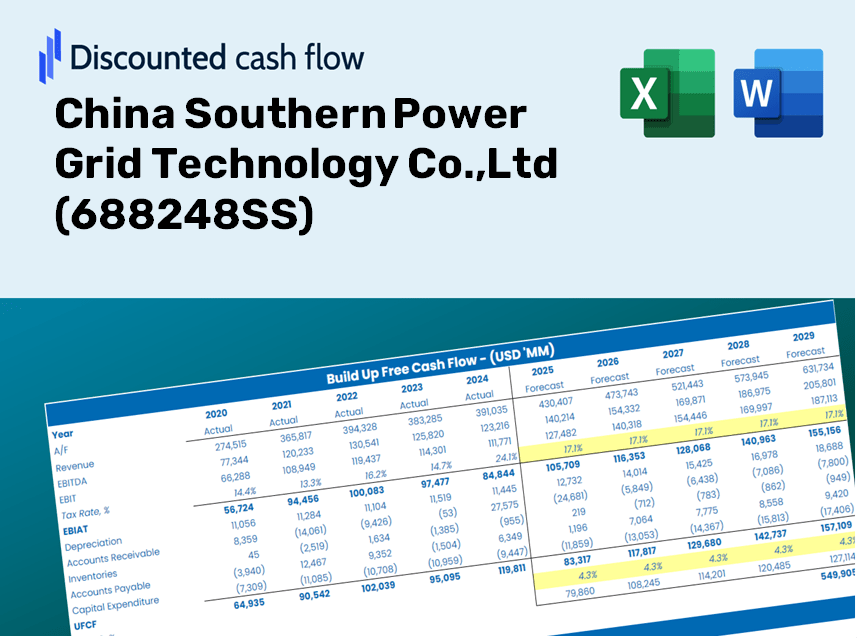
China Southern Power Grid Technology Co.,Ltd (688248.SS) Bundle
Vous cherchez à évaluer la valeur intrinsèque de China Southern Power Grid Technology Co., Ltd? Notre calculatrice DCF (688248SS) intègre des données réelles avec des fonctionnalités de personnalisation complètes, vous permettant d'affiner vos prévisions et d'améliorer vos stratégies d'investissement.
Discounted Cash Flow (DCF) - (USD MM)
| Year | AY1 2020 |
AY2 2021 |
AY3 2022 |
AY4 2023 |
AY5 2024 |
FY1 2025 |
FY2 2026 |
FY3 2027 |
FY4 2028 |
FY5 2029 |
|---|---|---|---|---|---|---|---|---|---|---|
| Revenue | 1,114.5 | 1,385.2 | 1,789.7 | 2,537.3 | 3,013.5 | 3,353.2 | 3,731.2 | 4,151.7 | 4,619.7 | 5,140.4 |
| Revenue Growth, % | 0 | 24.28 | 29.2 | 41.77 | 18.77 | 11.27 | 11.27 | 11.27 | 11.27 | 11.27 |
| EBITDA | 125.0 | 156.7 | 211.2 | 318.6 | 425.6 | 409.1 | 455.2 | 506.5 | 563.6 | 627.2 |
| EBITDA, % | 11.22 | 11.31 | 11.8 | 12.56 | 14.12 | 12.2 | 12.2 | 12.2 | 12.2 | 12.2 |
| Depreciation | 25.2 | 26.6 | 29.7 | 51.8 | 62.1 | 66.7 | 74.2 | 82.5 | 91.8 | 102.2 |
| Depreciation, % | 2.26 | 1.92 | 1.66 | 2.04 | 2.06 | 1.99 | 1.99 | 1.99 | 1.99 | 1.99 |
| EBIT | 99.9 | 130.0 | 181.5 | 266.8 | 363.5 | 342.5 | 381.1 | 424.0 | 471.8 | 525.0 |
| EBIT, % | 8.96 | 9.39 | 10.14 | 10.51 | 12.06 | 10.21 | 10.21 | 10.21 | 10.21 | 10.21 |
| Total Cash | 1,386.5 | 2,280.0 | 2,409.5 | 2,528.9 | 2,418.0 | 3,218.5 | 3,581.2 | 3,984.9 | 4,434.0 | 4,933.8 |
| Total Cash, percent | .0 | .0 | .0 | .0 | .0 | .0 | .0 | .0 | .0 | .0 |
| Account Receivables | 231.6 | 338.7 | 491.6 | 532.2 | 619.8 | 766.2 | 852.6 | 948.7 | 1,055.6 | 1,174.6 |
| Account Receivables, % | 20.78 | 24.45 | 27.47 | 20.98 | 20.57 | 22.85 | 22.85 | 22.85 | 22.85 | 22.85 |
| Inventories | 150.4 | 228.3 | 404.3 | 870.0 | 798.5 | 760.2 | 845.9 | 941.2 | 1,047.3 | 1,165.3 |
| Inventories, % | 13.5 | 16.48 | 22.59 | 34.29 | 26.5 | 22.67 | 22.67 | 22.67 | 22.67 | 22.67 |
| Accounts Payable | 398.2 | 454.3 | 504.5 | 709.7 | 786.7 | 1,011.3 | 1,125.2 | 1,252.1 | 1,393.2 | 1,550.2 |
| Accounts Payable, % | 35.73 | 32.79 | 28.19 | 27.97 | 26.11 | 30.16 | 30.16 | 30.16 | 30.16 | 30.16 |
| Capital Expenditure | -76.2 | -48.8 | -84.9 | -122.3 | -180.4 | -173.7 | -193.3 | -215.1 | -239.4 | -266.3 |
| Capital Expenditure, % | -6.84 | -3.52 | -4.75 | -4.82 | -5.99 | -5.18 | -5.18 | -5.18 | -5.18 | -5.18 |
| Tax Rate, % | 11.04 | 11.04 | 11.04 | 11.04 | 11.04 | 11.04 | 11.04 | 11.04 | 11.04 | 11.04 |
| EBITAT | 89.1 | 118.0 | 169.0 | 239.0 | 323.4 | 309.3 | 344.2 | 383.0 | 426.2 | 474.2 |
| Depreciation | ||||||||||
| Changes in Account Receivables | ||||||||||
| Changes in Inventories | ||||||||||
| Changes in Accounts Payable | ||||||||||
| Capital Expenditure | ||||||||||
| UFCF | 54.2 | -33.0 | -164.9 | -132.6 | 265.9 | 318.7 | 167.0 | 185.8 | 206.7 | 230.0 |
| WACC, % | 6.96 | 6.96 | 6.96 | 6.96 | 6.96 | 6.96 | 6.96 | 6.96 | 6.96 | 6.96 |
| PV UFCF | ||||||||||
| SUM PV UFCF | 918.2 | |||||||||
| Long Term Growth Rate, % | 2.00 | |||||||||
| Free cash flow (T + 1) | 235 | |||||||||
| Terminal Value | 4,735 | |||||||||
| Present Terminal Value | 3,383 | |||||||||
| Enterprise Value | 4,301 | |||||||||
| Net Debt | -1,645 | |||||||||
| Equity Value | 5,947 | |||||||||
| Diluted Shares Outstanding, MM | 562 | |||||||||
| Equity Value Per Share | 10.59 |
What You Will Receive
- Genuine CSPS Financials: Access comprehensive historical and projected data for precise valuation.
- Customizable Inputs: Adjust WACC, tax rates, revenue growth, and capital expenditures as needed.
- Dynamic Calculations: Intrinsic value and NPV are automatically computed for your convenience.
- Scenario Analysis: Explore various scenarios to assess the future performance of China Southern Power Grid Technology Co., Ltd (688248SS).
- User-Friendly Design: Perfectly tailored for professionals, yet easy for newcomers to navigate.
Key Features
- 🔍 Real-Life CSPS Financials: Pre-filled historical and projected data for China Southern Power Grid Technology Co., Ltd (688248SS).
- ✏️ Fully Customizable Inputs: Adjust all critical parameters (yellow cells) such as WACC, growth %, and tax rates.
- 📊 Professional DCF Valuation: Built-in formulas calculate the intrinsic value of CSPS using the Discounted Cash Flow method.
- ⚡ Instant Results: Visualize CSPS’s valuation immediately after making any adjustments.
- Scenario Analysis: Test and compare different outcomes based on various financial assumptions side-by-side.
How It Operates
- Step 1: Download the Excel spreadsheet.
- Step 2: Examine the pre-filled data for China Southern Power Grid Technology Co., Ltd (688248SS) (historical and projected).
- Step 3: Modify key assumptions (highlighted in yellow) based on your insights.
- Step 4: Observe automatic recalculations for the intrinsic value of China Southern Power Grid Technology Co., Ltd (688248SS).
- Step 5: Utilize the results for investment strategies or reporting purposes.
Why Opt for This Calculator?
- User-Friendly Interface: Crafted for both novices and seasoned professionals.
- Customizable Inputs: Easily adjust parameters to suit your analysis needs.
- Real-Time Feedback: Observe immediate updates to China Southern Power Grid Technology Co., Ltd's (688248SS) valuation as you modify inputs.
- Pre-Configured Data: Comes with China Southern Power Grid Technology Co., Ltd's (688248SS) actual financial information for quick evaluations.
- Relied Upon by Experts: A trusted tool for investors and analysts making informed choices.
Who Should Use This Product?
- Engineering Students: Master power system analysis techniques and apply them using industry-standard data.
- Researchers: Integrate cutting-edge models into your academic projects or studies.
- Investors: Evaluate your assumptions and assess valuation metrics for China Southern Power Grid Technology Co.,Ltd (688248SS).
- Industry Analysts: Enhance your efficiency with a customizable financial model tailored for energy companies.
- Entrepreneurs: Understand the analytical frameworks used to evaluate large utility firms like China Southern Power Grid Technology Co.,Ltd (688248SS).
Contents of the Template
- Operating and Balance Sheet Data: Pre-filled historical data and forecasts for China Southern Power Grid Technology Co., Ltd (688248SS), including figures for revenue, EBITDA, EBIT, and capital expenditures.
- WACC Calculation: A dedicated sheet for calculating the Weighted Average Cost of Capital (WACC), incorporating essential parameters such as Beta, risk-free rate, and share price.
- DCF Valuation (Unlevered and Levered): Customizable Discounted Cash Flow models providing insights into intrinsic value with comprehensive calculations.
- Financial Statements: Pre-loaded annual and quarterly financial statements to facilitate thorough analysis.
- Key Ratios: A collection of important profitability, leverage, and efficiency ratios for China Southern Power Grid Technology Co., Ltd (688248SS).
- Dashboard and Charts: A visual summary of valuation outputs and assumptions to simplify result analysis.
Disclaimer
All information, articles, and product details provided on this website are for general informational and educational purposes only. We do not claim any ownership over, nor do we intend to infringe upon, any trademarks, copyrights, logos, brand names, or other intellectual property mentioned or depicted on this site. Such intellectual property remains the property of its respective owners, and any references here are made solely for identification or informational purposes, without implying any affiliation, endorsement, or partnership.
We make no representations or warranties, express or implied, regarding the accuracy, completeness, or suitability of any content or products presented. Nothing on this website should be construed as legal, tax, investment, financial, medical, or other professional advice. In addition, no part of this site—including articles or product references—constitutes a solicitation, recommendation, endorsement, advertisement, or offer to buy or sell any securities, franchises, or other financial instruments, particularly in jurisdictions where such activity would be unlawful.
All content is of a general nature and may not address the specific circumstances of any individual or entity. It is not a substitute for professional advice or services. Any actions you take based on the information provided here are strictly at your own risk. You accept full responsibility for any decisions or outcomes arising from your use of this website and agree to release us from any liability in connection with your use of, or reliance upon, the content or products found herein.