
|
Suzhou Zelgen Biopharmaceuticals Co., Ltd. (688266.SS) Évaluation DCF |
Entièrement Modifiable: Adapté À Vos Besoins Dans Excel Ou Sheets
Conception Professionnelle: Modèles Fiables Et Conformes Aux Normes Du Secteur
Pré-Construits Pour Une Utilisation Rapide Et Efficace
Compatible MAC/PC, entièrement débloqué
Aucune Expertise N'Est Requise; Facile À Suivre
Suzhou Zelgen Biopharmaceuticals Co., Ltd. (688266.SS) Bundle
Que vous soyez un investisseur ou un analyste, cette calculatrice DCF (688266SS) est votre ressource incontournable pour une évaluation précise. Préchargé avec des données réelles de Suzhou Zelgen Biopharmaceuticals Co., Ltd., vous pouvez facilement ajuster les prévisions et observer immédiatement les effets.
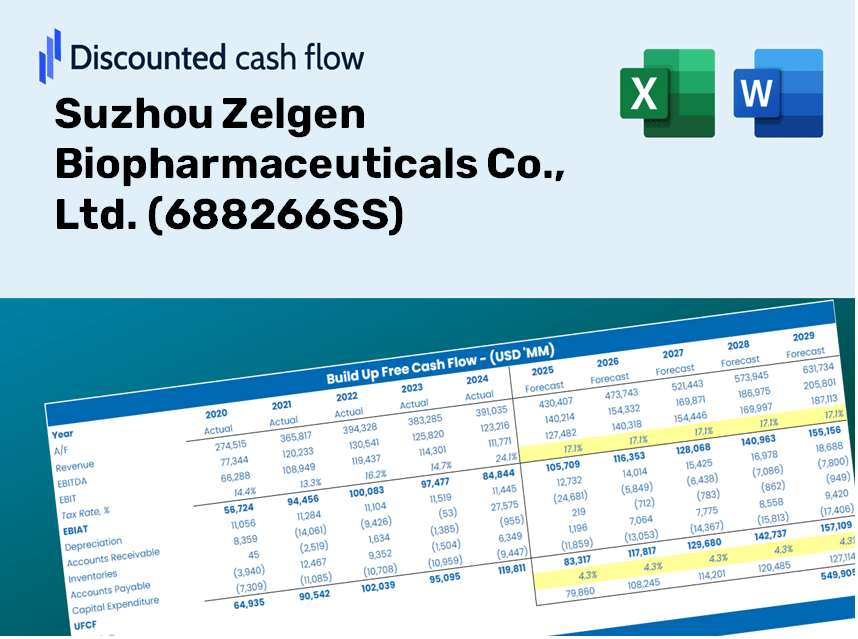
Discounted Cash Flow (DCF) - (USD MM)
| Year | AY1 2020 |
AY2 2021 |
AY3 2022 |
AY4 2023 |
AY5 2024 |
FY1 2025 |
FY2 2026 |
FY3 2027 |
FY4 2028 |
FY5 2029 |
|---|---|---|---|---|---|---|---|---|---|---|
| Revenue | 27.7 | 190.4 | 302.3 | 386.4 | 533.0 | 832.1 | 1,299.3 | 2,028.7 | 3,167.5 | 4,945.7 |
| Revenue Growth, % | 0 | 588.19 | 58.81 | 27.83 | 37.91 | 56.14 | 56.14 | 56.14 | 56.14 | 56.14 |
| EBITDA | -346.5 | -463.7 | -485.6 | -355.5 | -174.1 | -706.8 | -1,103.5 | -1,723.1 | -2,690.3 | -4,200.6 |
| EBITDA, % | -1252.63 | -243.57 | -160.62 | -92 | -32.67 | -84.93 | -84.93 | -84.93 | -84.93 | -84.93 |
| Depreciation | 34.7 | 42.3 | 52.5 | 41.9 | 42.9 | 263.7 | 411.8 | 643.0 | 1,003.9 | 1,567.5 |
| Depreciation, % | 125.52 | 22.2 | 17.37 | 10.84 | 8.05 | 31.69 | 31.69 | 31.69 | 31.69 | 31.69 |
| EBIT | -381.2 | -505.9 | -538.1 | -397.4 | -217.0 | -733.5 | -1,145.2 | -1,788.2 | -2,792.0 | -4,359.4 |
| EBIT, % | -1378.15 | -265.77 | -177.99 | -102.85 | -40.72 | -88.14 | -88.14 | -88.14 | -88.14 | -88.14 |
| Total Cash | 1,599.6 | 1,201.9 | 1,046.0 | 2,246.7 | 2,194.2 | 832.1 | 1,299.3 | 2,028.7 | 3,167.5 | 4,945.7 |
| Total Cash, percent | .0 | .0 | .0 | .0 | .0 | .0 | .0 | .0 | .0 | .0 |
| Account Receivables | 2.6 | 74.8 | 101.5 | 101.1 | 153.0 | 228.4 | 356.6 | 556.8 | 869.4 | 1,357.5 |
| Account Receivables, % | 9.47 | 39.31 | 33.57 | 26.17 | 28.71 | 27.45 | 27.45 | 27.45 | 27.45 | 27.45 |
| Inventories | 23.1 | 51.9 | 99.0 | 110.9 | 182.9 | 343.9 | 537.0 | 838.5 | 1,309.2 | 2,044.1 |
| Inventories, % | 83.65 | 27.27 | 32.74 | 28.69 | 34.31 | 41.33 | 41.33 | 41.33 | 41.33 | 41.33 |
| Accounts Payable | 65.0 | 118.2 | 151.7 | 137.7 | 197.1 | 474.2 | 740.3 | 1,155.9 | 1,804.9 | 2,818.1 |
| Accounts Payable, % | 234.83 | 62.09 | 50.19 | 35.64 | 36.98 | 56.98 | 56.98 | 56.98 | 56.98 | 56.98 |
| Capital Expenditure | -57.7 | -70.7 | -88.6 | -62.6 | -95.7 | -333.9 | -521.4 | -814.0 | -1,271.0 | -1,984.5 |
| Capital Expenditure, % | -208.53 | -37.16 | -29.32 | -16.2 | -17.95 | -40.13 | -40.13 | -40.13 | -40.13 | -40.13 |
| Tax Rate, % | 11.1 | 11.1 | 11.1 | 11.1 | 11.1 | 11.1 | 11.1 | 11.1 | 11.1 | 11.1 |
| EBITAT | -399.2 | -490.5 | -504.3 | -370.2 | -192.9 | -693.5 | -1,082.8 | -1,690.6 | -2,639.7 | -4,121.6 |
| Depreciation | ||||||||||
| Changes in Account Receivables | ||||||||||
| Changes in Inventories | ||||||||||
| Changes in Accounts Payable | ||||||||||
| Capital Expenditure | ||||||||||
| UFCF | -383.0 | -566.7 | -580.6 | -416.4 | -310.2 | -723.1 | -1,247.5 | -1,947.8 | -3,041.2 | -4,748.4 |
| WACC, % | 4.7 | 4.7 | 4.69 | 4.69 | 4.68 | 4.69 | 4.69 | 4.69 | 4.69 | 4.69 |
| PV UFCF | ||||||||||
| SUM PV UFCF | -9,833.5 | |||||||||
| Long Term Growth Rate, % | 2.00 | |||||||||
| Free cash flow (T + 1) | -4,843 | |||||||||
| Terminal Value | -179,938 | |||||||||
| Present Terminal Value | -143,074 | |||||||||
| Enterprise Value | -152,907 | |||||||||
| Net Debt | -1,131 | |||||||||
| Equity Value | -151,777 | |||||||||
| Diluted Shares Outstanding, MM | 265 | |||||||||
| Equity Value Per Share | -572.61 |
What You Will Receive
- Accurate 688266SS Financial Data: Access to both historical and projected data for precise valuation.
- Customizable Variables: Adjust inputs for WACC, tax rates, revenue growth, and capital investments.
- Automated Calculations: Dynamic calculations for intrinsic value and NPV.
- Scenario Analysis: Evaluate various scenarios to assess Suzhou Zelgen's future performance.
- User-Friendly Design: Tailored for industry professionals while remaining approachable for newcomers.
Key Features
- Comprehensive DCF Calculator: Features detailed unlevered and levered DCF valuation models tailored for Suzhou Zelgen Biopharmaceuticals Co., Ltd. (688266SS).
- WACC Tool: Pre-designed Weighted Average Cost of Capital sheet with adjustable inputs for personalized analysis.
- Customizable Forecast Parameters: Adjust growth projections, capital investments, and discount rates according to your needs.
- Integrated Financial Ratios: Evaluate profitability, leverage, and efficiency metrics specifically for Suzhou Zelgen Biopharmaceuticals Co., Ltd. (688266SS).
- Interactive Dashboard and Charts: Visual summaries of essential valuation metrics for straightforward analysis.
How It Works
- Step 1: Download the prebuilt Excel template featuring Suzhou Zelgen Biopharmaceuticals Co., Ltd. data.
- Step 2: Review the pre-filled sheets to familiarize yourself with the essential metrics.
- Step 3: Adjust forecasts and assumptions in the editable yellow cells (WACC, growth, margins).
- Step 4: Instantly see recalculated results, including the intrinsic value of Suzhou Zelgen Biopharmaceuticals Co., Ltd. (688266SS).
- Step 5: Utilize the outputs to make informed investment decisions or create detailed reports.
Why Opt for This Calculator?
- All-in-One Resource: Features DCF, WACC, and financial ratio analyses seamlessly integrated.
- Flexible Inputs: Modify yellow-highlighted fields to explore different scenarios.
- In-Depth Analysis: Automatically determines Suzhou Zelgen Biopharmaceuticals' intrinsic value and Net Present Value.
- Preloaded Information: Access to historical and projected data for reliable starting points.
- High-Quality Standards: Perfect for financial analysts, investors, and business advisors.
Who Should Use This Product?
- Individual Investors: Gain insights for making informed investment decisions regarding Suzhou Zelgen Biopharmaceuticals Co., Ltd. (688266SS).
- Financial Analysts: Enhance your valuation methodologies with comprehensive financial models tailored for biopharmaceuticals.
- Consultants: Provide clients with precise valuations and expert insights related to the biopharmaceutical sector.
- Business Owners: Learn how companies like Suzhou Zelgen Biopharmaceuticals Co., Ltd. (688266SS) are valued to inform your strategic planning.
- Finance Students: Explore valuation practices with practical examples and data from the biopharmaceutical industry.
Contents of the Template
- Pre-Filled DCF Model: Suzhou Zelgen Biopharmaceuticals’ financial data preloaded for immediate application.
- WACC Calculator: Comprehensive calculations for Weighted Average Cost of Capital.
- Financial Ratios: Analyze Suzhou Zelgen’s profitability, leverage, and operational efficiency.
- Editable Inputs: Modify assumptions such as growth rates, profit margins, and CAPEX to suit your scenarios.
- Financial Statements: Annual and quarterly reports for thorough analysis support.
- Interactive Dashboard: Effortlessly visualize key valuation metrics and outcomes.
Disclaimer
All information, articles, and product details provided on this website are for general informational and educational purposes only. We do not claim any ownership over, nor do we intend to infringe upon, any trademarks, copyrights, logos, brand names, or other intellectual property mentioned or depicted on this site. Such intellectual property remains the property of its respective owners, and any references here are made solely for identification or informational purposes, without implying any affiliation, endorsement, or partnership.
We make no representations or warranties, express or implied, regarding the accuracy, completeness, or suitability of any content or products presented. Nothing on this website should be construed as legal, tax, investment, financial, medical, or other professional advice. In addition, no part of this site—including articles or product references—constitutes a solicitation, recommendation, endorsement, advertisement, or offer to buy or sell any securities, franchises, or other financial instruments, particularly in jurisdictions where such activity would be unlawful.
All content is of a general nature and may not address the specific circumstances of any individual or entity. It is not a substitute for professional advice or services. Any actions you take based on the information provided here are strictly at your own risk. You accept full responsibility for any decisions or outcomes arising from your use of this website and agree to release us from any liability in connection with your use of, or reliance upon, the content or products found herein.